Filters: Tags: San Juan County (X)
857 results (12ms)|
Filters
Date Range
Extensions Types Contacts
Categories Tag Types
|
This dataset represents ease of access to bottomland areas for vegetation treatments. Access may be by road, 4x4 near road, hike in by field crews or requiring overnight camping or raft access. Access is considered for each side of the river separately.
Categories: Data;
Types: Citation,
Downloadable,
Map Service,
OGC WFS Layer,
OGC WMS Layer,
Shapefile;
Tags: Arches National Park,
Canyonlands National Park,
Colorado River,
Grand County,
Moab,
This data set shows the extent of the Colorado River Conservation Planning project bottomland area as delineated by topography and vegetation, The bottomland area is subdivided into 1 km polygons measured from the upstream project boundary. Reach breaks were determined by large topographic shifts and/or tributary junctions by John Dohrenwend. Please see the project report for more details.
Categories: Data;
Types: Downloadable,
Map Service,
OGC WFS Layer,
OGC WMS Layer,
Shapefile;
Tags: Arches National Park,
Canyonlands National Park,
Colorado River,
Grand County,
Moab,
This is a model showing general habitat diversity, including both the structural and cover type diversity. See Open File Report, Rasmussen and Shafroth, Colorado River Conservation Planning for geoprocessing details.
Categories: Data;
Types: Citation,
Downloadable,
Map Service,
OGC WFS Layer,
OGC WMS Layer,
Shapefile;
Tags: Arches National Park,
Canyonlands National Park,
Colorado River,
Grand County,
Moab,
This dataset represents the relative average amount of non-woody cover within 2 ha) of bottomland along the Colorado River from the Colorado state line (San Juan and Grand Counties, Utah) to the southern Canyonlands NP boundary, as of September 2010. Traditional image interpretation cues were used to develop the polygons, such as shape, size, pattern, tone, texture, color, and shadow, from high resolution, true color, aerial imagery (0.3m resolution), acquired for the project. Additional, public available aerial photos (NAIP, 2011) were used to cross-reference cover classes. As with any digital layer, this layer is a representation of what is actually occurring on the ground. Errors are inherent in any interpretation...
Categories: Data;
Types: Citation,
Downloadable,
Map Service,
OGC WFS Layer,
OGC WMS Layer,
Shapefile;
Tags: Arches National Park,
Canyonlands National Park,
Colorado River,
Grand County,
Moab,
This dataset represents the variety (unique structural classes: water, bare, herbaceous, short shrubs, medium shrubs, short trees, tall trees) within 1 ha of bottomland areas. Traditional image interpretation cues were used to develop the polygons, such as shape, size, pattern, tone, texture, color, and shadow, from high resolution, true color, aerial imagery (0.3m resolution), acquired for the project. Additional, public available aerial photos (NAIP, 2011) were used to cross-reference cover classes. As with any digital layer, this layer is a representation of what is actually occurring on the ground. Errors are inherent in any interpretation of ground qualities. Due to the "snapshot" nature of the aerial photos,...
Categories: Data;
Types: Citation,
Downloadable,
Map Service,
OGC WFS Layer,
OGC WMS Layer,
Shapefile;
Tags: Arches National Park,
Canyonlands National Park,
Colorado River,
Grand County,
Moab,
This map shows the channel boundary (2011) of the Colorado River mainstem between the Utah Colorado border and the upper pool of Lake Powell, Utah (146 miles). The channel boundary was mapped from public available NAIP imagery flown on June 28, 2011, when the river flow was 886 m3/s at the Cisco gage. The channel is subdivided into channel types: fast water (main channel, secondary channel), and still water types (backwater, isolated pool and tributary channel).
Categories: Data;
Types: Citation,
Downloadable,
Map Service,
OGC WFS Layer,
OGC WMS Layer,
Shapefile;
Tags: Arches National Park,
Canyonlands National Park,
Colorado River,
Grand County,
Moab,
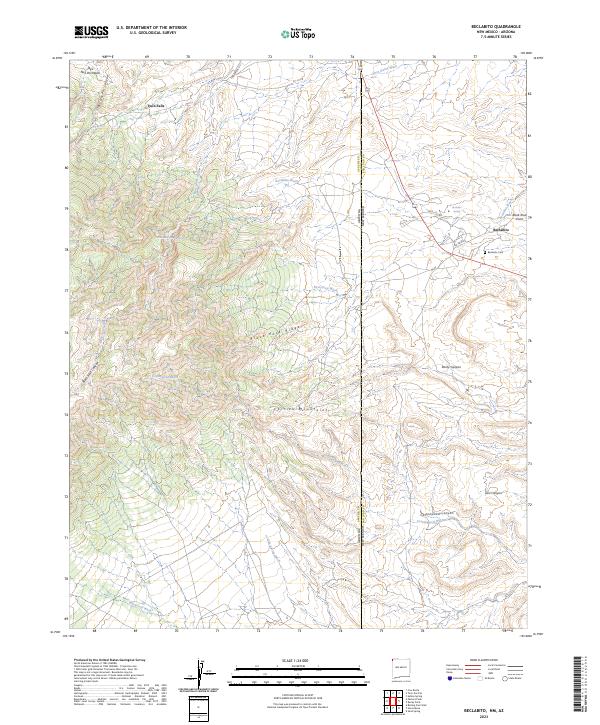
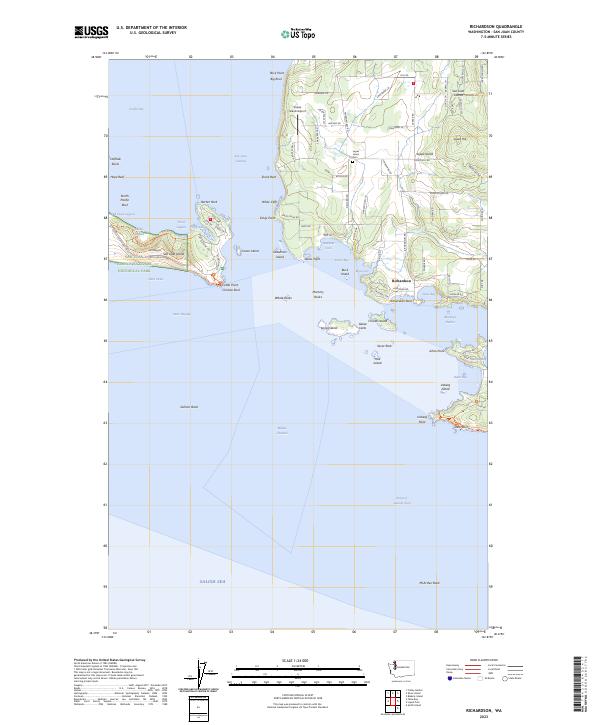
Layered geospatial PDF 7.5 Minute Quadrangle Map. Layers of geospatial data include orthoimagery, roads, grids, geographic names, elevation contours, hydrography, and other selected map features. This map is derived from GIS (geospatial information system) data. It represents a repackaging of GIS data in traditional map form, not creation of new information. The geospatial data in this map are from selected National Map data holdings and other government sources.
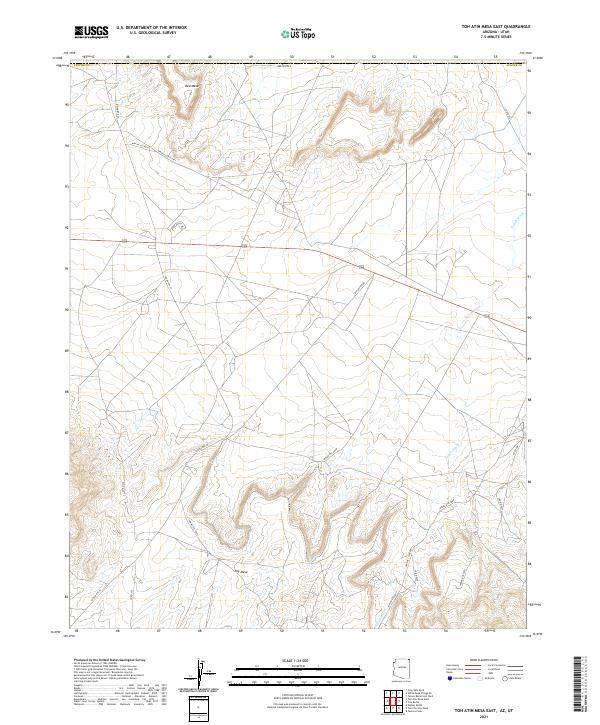
Layered geospatial PDF 7.5 Minute Quadrangle Map. Layers of geospatial data include orthoimagery, roads, grids, geographic names, elevation contours, hydrography, and other selected map features. This map is derived from GIS (geospatial information system) data. It represents a repackaging of GIS data in traditional map form, not creation of new information. The geospatial data in this map are from selected National Map data holdings and other government sources.
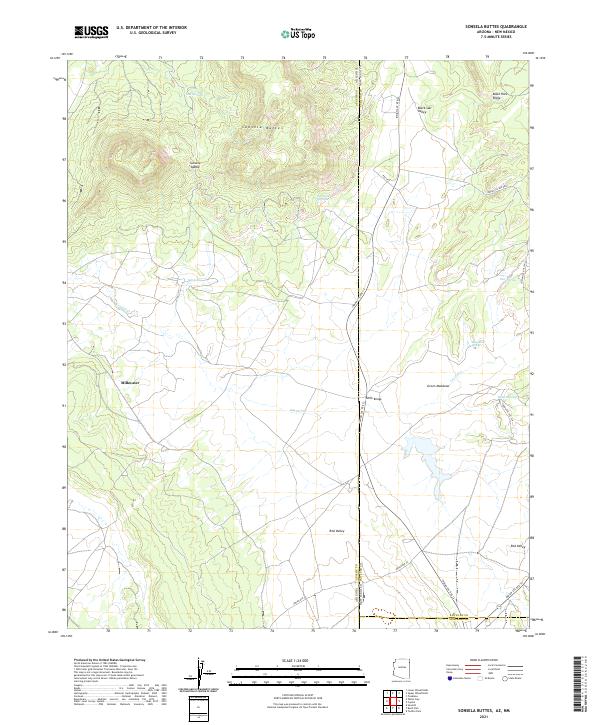
Layered geospatial PDF 7.5 Minute Quadrangle Map. Layers of geospatial data include orthoimagery, roads, grids, geographic names, elevation contours, hydrography, and other selected map features. This map is derived from GIS (geospatial information system) data. It represents a repackaging of GIS data in traditional map form, not creation of new information. The geospatial data in this map are from selected National Map data holdings and other government sources.
This polygon feature class represents vegetation communities mapped at Canyonlands National Park. The polygons were generated using guidelines set by the Standardized National Vegetation Classification System (October 1995). A combination of methods were used to map Canyonlands. The USGS used e-Cognition software to create segments. The segments created were then looked at and extensively edited by the vegetation mappers. Some mapping was done on screen, using the 2002 imagery. Hard copy 9X9 photography was used for photo interpretation. Traditional image interpretation cues were used to develop the polygons, such as shape, size, pattern, tone, texture, color, and shadow. Additional data layers were used in aiding...
Layered geospatial PDF 7.5 Minute Quadrangle Map. Layers of geospatial data include orthoimagery, roads, grids, geographic names, elevation contours, hydrography, and other selected map features. This map is derived from GIS (geospatial information system) data. It represents a repackaging of GIS data in traditional map form, not creation of new information. The geospatial data in this map are from selected National Map data holdings and other government sources.
Layered geospatial PDF 7.5 Minute Quadrangle Map. Layers of geospatial data include orthoimagery, roads, grids, geographic names, elevation contours, hydrography, and other selected map features. This map is derived from GIS (geospatial information system) data. It represents a repackaging of GIS data in traditional map form, not creation of new information. The geospatial data in this map are from selected National Map data holdings and other government sources.
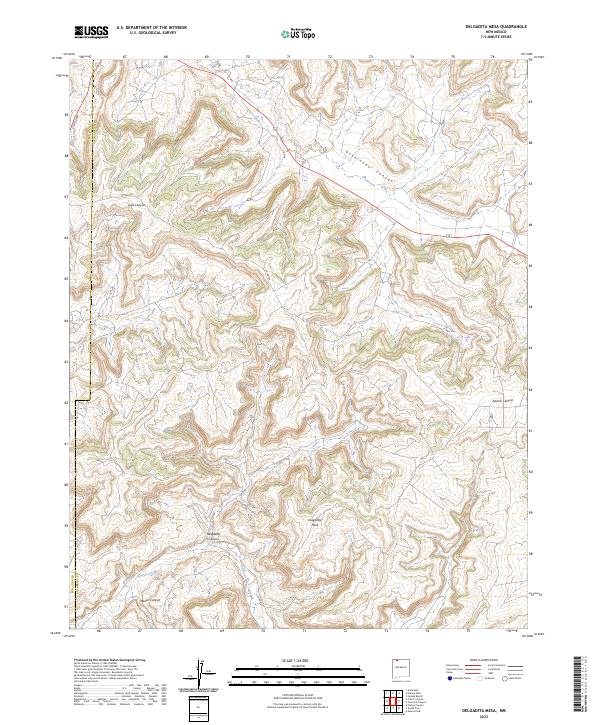
Layered geospatial PDF 7.5 Minute Quadrangle Map. Layers of geospatial data include orthoimagery, roads, grids, geographic names, elevation contours, hydrography, and other selected map features. This map is derived from GIS (geospatial information system) data. It represents a repackaging of GIS data in traditional map form, not creation of new information. The geospatial data in this map are from selected National Map data holdings and other government sources.
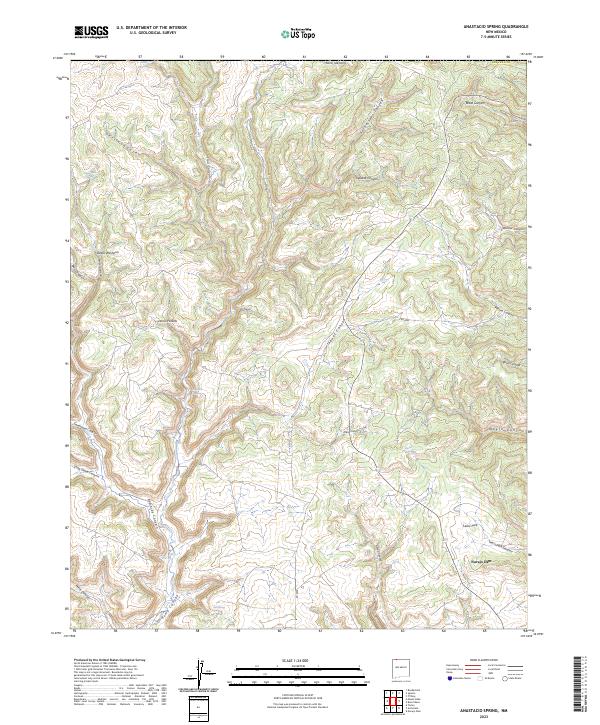
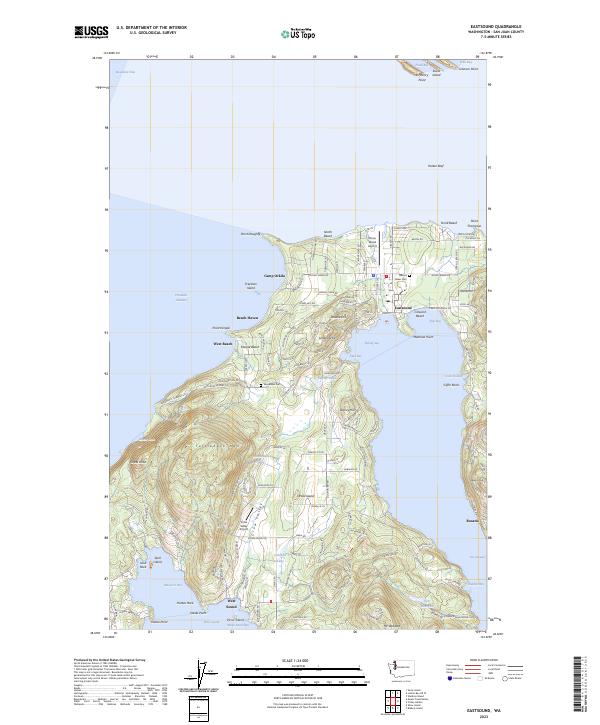
Layered geospatial PDF 7.5 Minute Quadrangle Map. Layers of geospatial data include orthoimagery, roads, grids, geographic names, elevation contours, hydrography, and other selected map features. This map is derived from GIS (geospatial information system) data. It represents a repackaging of GIS data in traditional map form, not creation of new information. The geospatial data in this map are from selected National Map data holdings and other government sources.
Layered geospatial PDF 7.5 Minute Quadrangle Map. Layers of geospatial data include orthoimagery, roads, grids, geographic names, elevation contours, hydrography, and other selected map features. This map is derived from GIS (geospatial information system) data. It represents a repackaging of GIS data in traditional map form, not creation of new information. The geospatial data in this map are from selected National Map data holdings and other government sources.
Layered geospatial PDF 7.5 Minute Quadrangle Map. Layers of geospatial data include orthoimagery, roads, grids, geographic names, elevation contours, hydrography, and other selected map features. This map is derived from GIS (geospatial information system) data. It represents a repackaging of GIS data in traditional map form, not creation of new information. The geospatial data in this map are from selected National Map data holdings and other government sources.
Layered geospatial PDF 7.5 Minute Quadrangle Map. Layers of geospatial data include orthoimagery, roads, grids, geographic names, elevation contours, hydrography, and other selected map features. This map is derived from GIS (geospatial information system) data. It represents a repackaging of GIS data in traditional map form, not creation of new information. The geospatial data in this map are from selected National Map data holdings and other government sources.
Layered geospatial PDF 7.5 Minute Quadrangle Map. Layers of geospatial data include orthoimagery, roads, grids, geographic names, elevation contours, hydrography, and other selected map features. This map is derived from GIS (geospatial information system) data. It represents a repackaging of GIS data in traditional map form, not creation of new information. The geospatial data in this map are from selected National Map data holdings and other government sources.
Layered geospatial PDF 7.5 Minute Quadrangle Map. Layers of geospatial data include orthoimagery, roads, grids, geographic names, elevation contours, hydrography, and other selected map features. This map is derived from GIS (geospatial information system) data. It represents a repackaging of GIS data in traditional map form, not creation of new information. The geospatial data in this map are from selected National Map data holdings and other government sources.
Layered geospatial PDF 7.5 Minute Quadrangle Map. Layers of geospatial data include orthoimagery, roads, grids, geographic names, elevation contours, hydrography, and other selected map features. This map is derived from GIS (geospatial information system) data. It represents a repackaging of GIS data in traditional map form, not creation of new information. The geospatial data in this map are from selected National Map data holdings and other government sources.
|

|
