|
|

This dataset contains watershed means of estimated percent impervious surfaces for three time periods: 1992, 2002, and 2012. Estimates are based on coefficients derived from comparing land use of the 2012 NAWQA Wall-to-wall Anthropogenic Land-use Trends (NWALT) product to the 2011 National Land Cover Database (NLCD) imperviousness, then applying those coefficients to previous years (1974-2002) of the NWALT dataset.
Categories: Data;
Types: Citation;
Tags: Chesapeake Bay,
Delaware,
District of Columbia,
James River,
Maryland, All tags...
New York,
Pennsylvania,
Potomac River,
Rappahannock River,
Susquehanna River,
Virginia,
West Virginia,
impervious surfaces,
surface water quality, Fewer tags
|

The dataset contains estimates for total phosphorus flux from wastewater treatment plants that discharge to surface water within the Red River of the North Basin in the United States and subbasins. Shapefiles defining the subbasins are available as part of the same data release in which these data are published. Estimates of wastewater treatment plant total phosphorus flux (or load) were calculated by Tammy Ivanhnenko for the years 1978, 1980, 1982, 1984, 1986, 1988, 1990, 1992, 1996, 2000, 2004, 2008, and 2012. Flux estimates were based on the average discharge from the wastewater treatment plants and treatment level, both reported as part of the U.S. Environmental Protection Agency's Clean Watershed Needs Survey,...
Categories: Data;
Types: Citation;
Tags: Crookston,
Emerson,
Fargo,
Halstad,
Kindred, All tags...
Minnesota,
Moorhead,
Neche,
North Dakota,
Pembina River,
Red Lake River,
Red River of the North,
Sheyenne River,
South Dakota,
nutrient content (water),
surface water quality,
total phosphorus,
wastewater discharge, Fewer tags
|

This dataset consists of a series of rasters covering the conterminous United States. Each raster is a one kilometer (km) grid for 18 selected Census of Agriculture statistics mapped to land use pixels for the time period 1950 to 2012. A supplemental set of 9 statistics mapped at the entire county level are also provided as 1-km rasters. The rasters are posted as ArcGIS grids. The statistics represent values for crops, livestock, irrigation, fertilizer, and manure usage. Most statistics are mapped for all 14 Census of Agriculture reporting years in that time frame: 1950, 1954, 1959, 1964, 1969, 1974, 1978, 1982, 1987, 1992, 1997, 2002, 2007, and 2012.
Categories: Data;
Types: Citation;
Tags: Census of Agriculture,
Conterminous U.S.,
Cropland,
Crops,
Dasymetric mapping, All tags...
Fertilizer,
Historical agricultural data,
Irrigation,
Land Use Change,
Land use,
Livestock,
Manure,
NWALT,
National Water Quality Program,
USGS Science Data Catalog (SDC),
United States, Fewer tags
|

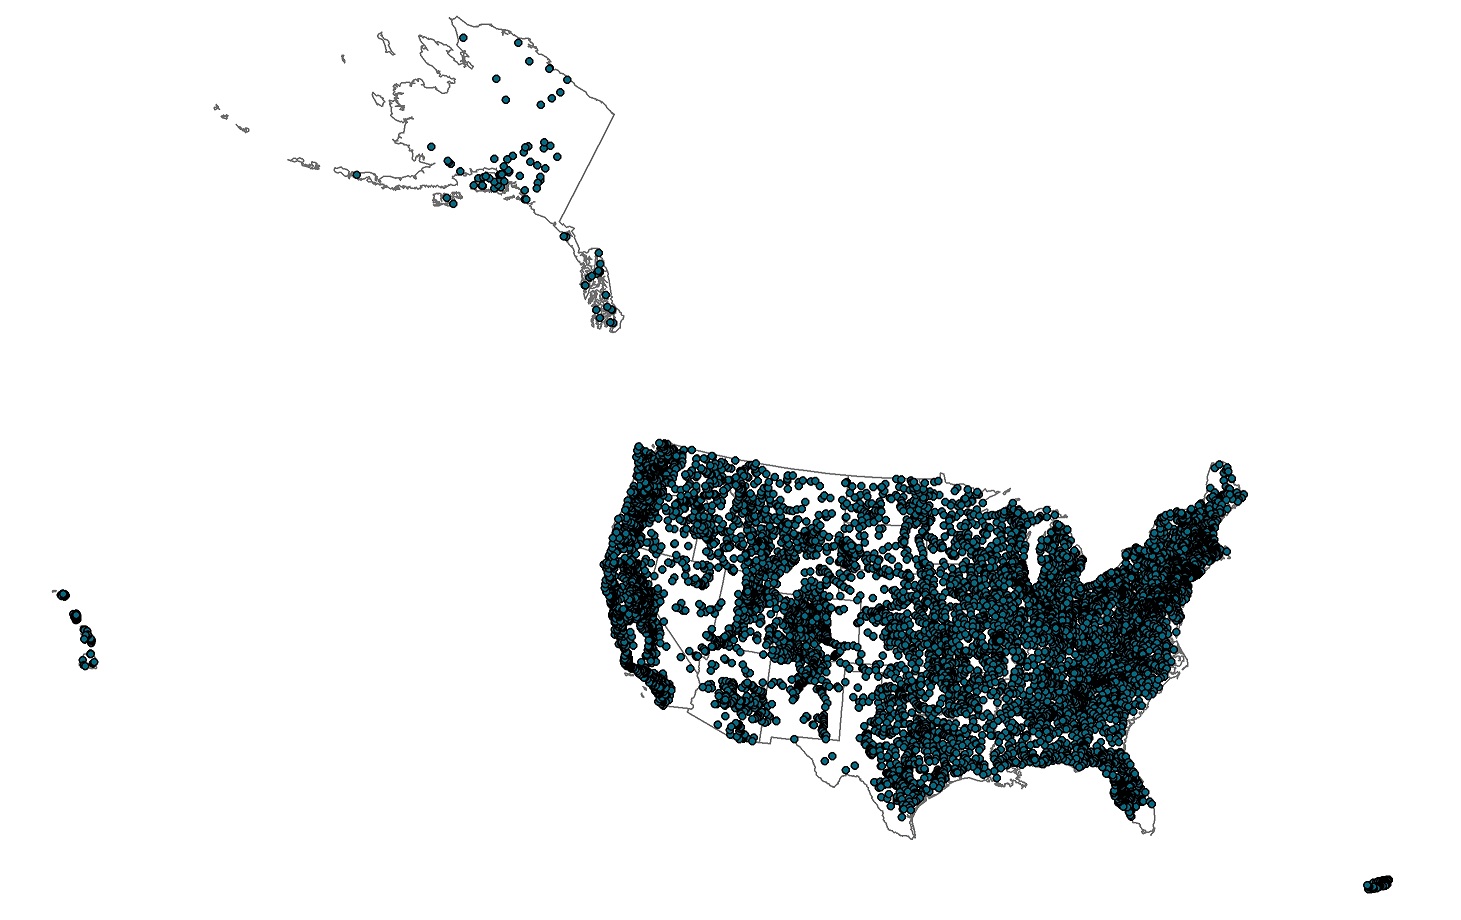
This dataset, termed "GAGES II", an acronym for Geospatial Attributes of Gages for Evaluating Streamflow, version II, provides geospatial data and classifications for 9,322 stream gages maintained by the U.S. Geological Survey (USGS). It is an update to the original GAGES, which was published as a Data Paper on the journal Ecology's website (Falcone and others, 2010b) in 2010. The GAGES II dataset consists of gages which have had either 20+ complete years (not necessarily continuous) of discharge record since 1950, or are currently active, as of water year 2009, and whose watersheds lie within the United States, including Alaska, Hawaii, and Puerto Rico. Reference gages were identified based on indicators that they...
Types: Map Service,
OGC WFS Layer,
OGC WMS Layer,
OGC WMS Service;
Tags: Alabama,
Alaska,
All 50 states,
Arizona,
Arkansas, All tags...
California,
Colorado,
Connecticut,
Delaware,
District of Columbia,
Florida,
GAGES,
Georgia,
HCDN,
Hawaii,
Hydrological,
Hydrology,
Idaho,
Illinois,
Indiana,
Iowa,
Kansas,
Kentucky,
Louisiana,
Maine,
Maryland,
Massachusetts,
Michigan,
Minnesota,
Mississippi,
Missouri,
Montana,
NPLCC,
Nebraska,
Nevada,
New Hampshire,
New Jersey,
New Mexico,
New York,
North Carolina,
North Dakota,
North Pacific Landscape Conservation Cooperative,
Ohio,
Oklahoma,
Oregon,
Pennsylvania,
Puerto Rico,
Rhode Island,
South Carolina,
South Dakota,
Tennessee,
Texas,
USGS,
USGS gages,
United States,
Utah,
Vermont,
Virginia,
Washington,
West Virginia,
Wisconsin,
Wyoming,
hydrologic condition,
hydrologic modification,
inlandWaters,
reference watersheds,
streamflow,
streamgage network,
water resources, Fewer tags
|

In 2015, the second of several Regional Stream Quality Assessments (RSQA) was done in the southeastern United States. The Southeast Stream Quality Assessment (SESQA) was a study by the U.S. Geological Survey (USGS) National Water Quality Assessment (NAWQA) project. One of the objectives of the RSQA, and thus the SESQA, is to characterize the relationships between water-quality stressors and stream ecology and subsequently determine the relative effects of these stressors on aquatic biota within the streams (Van Metre and Journey, 2014). To meet this objective, a framework of fundamental geospatial data was required to develop physical and anthropogenic characteristics of the study region, sampled sites and corresponding...
Types: Map Service,
OGC WFS Layer,
OGC WMS Layer,
OGC WMS Service;
Tags: Ecology,
National Water Quality Program,
Riparian Zones,
Sampling sites,
USGS Science Data Catalog (SDC), All tags...
Water Quality,
Water Quality,
Water Resources,
Watersheds, Fewer tags
|
View more...
|