Filters: Extensions: OGC Web Service (X)
Folders: ROOT > Users ( Show direct descendants )
11 results (12ms)
Location
Folder
ROOT _Users Filters
Date Range
Extensions Types
Contacts
Categories Tag Types
|
Transport of material in an estuary is important for water quality and hazards concern. We studied these processes in the Hudson River Estuary, located along the northeast coast of the U.S. using the COAWST numerical modeling system. A skill assessment of the COAWST model for the 3-D salinity structure of the estuary has been successfully studied in the past, and the present research extended that understanding to look at both physical and numerical mixing. The model grid extends from the south at the Battery, NY to the north in Troy, NY. The simulation is performed from March 25 to July 11, 2005 (111 days). For more information see: https://doi.org/10.5066/P95E8LAS.
Categories: Data;
Types: Map Service,
NetCDF OPeNDAP Service,
OGC WMS Layer;
Tags: CMG_Portal,
Earth Science > Human Dimensions > Natural Hazards > Floods,
Earth Science > Oceans > Marine Sediments >Sediment Transport,
Earth Science > Oceans > Ocean Circulation > Ocean Currents,
Earth Science > Oceans > Ocean Temperature > Potential Temperature,
A polygon layer of regions of multiple planetary bodies beyond Earth that are covered by proposed or published planetary geologic maps published by the USGS.
Categories: Data;
Types: Map Service,
OGC WFS Layer;
Tags: Geologic maps,
Planetary Sciences,
Planetary analogs,
Planetary sciences,
USGS Science Data Catalog (SDC)
Simulation of hydrodynamic circulation in Barnegat Bay for the period from 03-01-2012 to 10-01-2012. The bathymetry of the model was based on the National Ocean Service Hydrographic Survey data, and updated with recent bathymetric measurements. At the landward end (western boundary), we specified point sources of freshwater in accordance with USGS streamflow measurements at 7 gauges, and a radiation boundary condition that allows tidal energy to propagate landward. On the seaward end, tidal water level and velocity amplitudes from the ADCIRC tidal database for the North Atlantic were applied. These were supplemented by the subtidal water level and subtidal barotropic velocity from the ESPreSSO model, which covers...
Categories: Data;
Types: Map Service,
NetCDF OPeNDAP Service,
OGC WFS Layer,
OGC WMS Layer,
OGC WMS Service;
Tags: CMG_Portal,
Earth Science > Oceans > Ocean Circulation > Ocean Currents,
Earth Science > Oceans > Ocean Temperature > Potential Temperature,
Earth Science > Oceans > Salinity/Density > Salinity,
Earth Science > Oceans > Sea Surface Topography > Sea Surface Height,
The U.S. Geological Survey (USGS), in cooperation with the Arkansas Natural Resources Commission, Arkansas Geological Survey, and the Union County Water Conservation Board, has monitored water levels as a part of an ongoing effort to provide information for management of the Sparta-Memphis aquifer. The USGS has produced reports, at various intervals, to describe groundwater conditions in the Sparta-Memphis aquifer. These datasets provide the locations of and groundwater-level altitudes from 306 wells that were used to construct a potentiometric contour surface of the Sparta-Memphis aquifer. Measurements were made from January through May 2013 and represent synoptic conditions. All wells were cased completely in...
Categories: Data;
Types: Map Service,
OGC WMS Layer;
Tags: Arkansas,
Mississippi Embayment aquifer system,
Sparta-Memphis Sand,
USGS Science Data Catalog (SDC),
aquifer,
Daily streamflow discharge data from 139 streamgages located on tributaries and streams flowing to the Gulf of Mexico were used to calculate mean monthly, mean seasonal, and decile values. Streamgages used to calculate trends required a minimum of 65 years of continuous daily streamflow data. These values were used to analyze trends in streamflow using the Mann-Kendall trend test in the R package entitled “Trends” and a new methodology created by Robert M. Hirsch known as a “Quantile-Kendall” plot. Data were analyzed based on water year using the Mann-Kendall trend test and by climate year using the Quantile-Kendall methodology to: (1) identify regions which are statistically similar for estimating streamflow characteristics;...
Categories: Data,
Data Release - Revised;
Types: Map Service,
OGC WMS Layer;
Tags: Alabama,
Florida,
Gulf Coast,
Gulf Coast,
Gulf of Mexico,
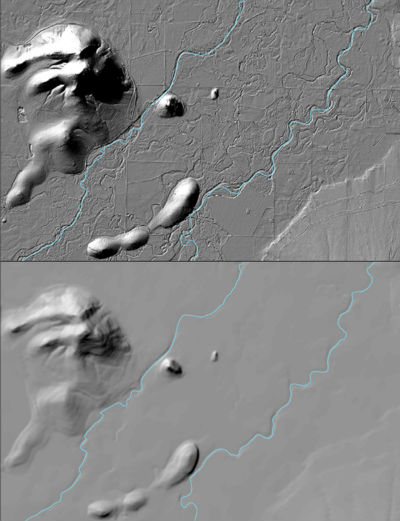
The USGS 3D Elevation Program (3DEP) Datasets from The National Map are the primary elevation data product produced and distributed by the USGS. The 3DEP program provides a variety of resolution raster elevation data of the conterminous United States, Alaska, Hawaii, and the island territories. Some of the data sets such as the 1/3rd arc-second and 1 arc-second data set are derived from diverse source data sets that are processed to a specification with a consistent resolution, coordinate system, elevation units, and horizontal and vertical datums. These seamless DEMs were referred to as the National Elevation Dataset (NED) from about 2000 through 2015 at which time they became the seamless DEM layers under the...
The COAWST modeling system has been used to simulate ocean and wave processes along the of US East Coast and Gulf of Mexico. The grid has a horizontal resolution of approximately 5km and is resolved with 16 vertical terrain following levels. The model has been executed on a daily basis since 2010 with outputs written every hour. Data access is available through a Globus access portal here: https://app.globus.org/file-manager?origin_id=2e58c429-d1cf-4808-85a7-0d8214a4547e&origin_path=%2F References cited: Warner, J.C., Armstrong, Brandy, He, Ruoying, and Zambon, J.B., 2010, Development of a coupled ocean-atmosphere-wave-sediment transport (COAWST) modeling system: Ocean Modelling, v. 35, issue 3, p. 230-244. ...
Categories: Data;
Types: Map Service,
NetCDF OPeNDAP Service,
OGC WMS Layer;
Tags: CMG_Portal,
Earth Science > Human Dimensions > Natural Hazards > Floods,
Earth Science > Oceans > Marine Sediments >Sediment Transport,
Earth Science > Oceans > Ocean Circulation > Ocean Currents,
Earth Science > Oceans > Ocean Temperature > Potential Temperature,
This data set represents the extent, approximate location and type of wetlands and deepwater habitats in the United States and its Trust Territories. These data delineate the areal extent of wetlands and surface waters as defined by Cowardin et al. (1979). Certain wetland habitats may be excluded because of the limitations of aerial imagery as the primary data source used to detect wetlands. These habitats include seagrasses or submerged aquatic vegetation that are found in the intertidal and subtidal zones of estuaries and near shore coastal waters. Some deepwater reef communities (coral or tuberficid worm reefs) have also been excluded from the inventory. These habitats, because of their depth, go undetected by...
Categories: Data;
Types: ArcGIS REST Map Service,
Map Service,
OGC WMS Layer;
Tags: Swamps, marshes, bogs, fens,
USFWS,
fens,
swamps,
wetlands
Marshes may drown if they are unable to accrete sediment at the rate of sea level rise, but predicting the rate of sediment accretion at different marshes is challenging because many processes (e.g. tidal range, wave frequency) and conditions (e.g. available sediment, vegetation density, shape of the marsh edge) impact it. The Coupled Ocean-Atmosphere-Wave-Sediment Transport (COAWST, Warner and others 2019; Warner and others 2010) model was used to simulate three-dimensional hydrodynamics, waves, and sediment transport on a marsh platform in an idealized domain. The computational grid was 400 (20) cells in the cross-shore (along-shore) directions with 10 vertical sigma layers, and a cross-shore horizontal resolution...
Categories: Data;
Types: Map Service,
NetCDF OPeNDAP Service,
OGC WMS Layer;
Tags: Earth Science > Oceans > Coastal Processes > Estuaries,
Earth Science > Oceans > Coastal Processes > Marshes,
Earth Science > Oceans > Coastal Processes > Sediment Transport,
Earth Science > Oceans > Coastal Processes > Sedimentation,
Hydrology,
The COAWST (Coupled Ocean-Atmosphere-Wave-Sediment Transport) modeling framework was extended to add two key processes that affect marshes, erosion due to lateral wave thrust (LWT) and vertical accretion due to biomass productivity. The testing of the combined effects of integrating these two processes was done by modeling marsh complexes within Forsythe National Wildlife Refuge and the Barnegat Bay (BB) estuary, New Jersey, USA. The simulations were performed first for the month of May 2015 for the entire Barnegat Bay. The Barnegat Bay estuary solution was used to force the two smaller domains that encompass Reedy and Dinner Creeks and are modeled for the same time period.
Categories: Data;
Types: Map Service,
NetCDF OPeNDAP Service,
OGC WMS Layer;
Tags: CMG_Portal,
Earth Science > Human Dimensions > Natural Hazards > Floods,
Earth Science > Oceans > Marine Sediments >Sediment Transport,
Earth Science > Oceans > Ocean Circulation > Ocean Currents,
Earth Science > Oceans > Ocean Temperature > Potential Temperature,
|

|
