Filters: Types: Map Service (X) > partyWithName: U.S. Geological Survey (X)
Folders: ROOT > Users ( Show direct descendants )
190 results (16ms)
Location
Folder
ROOT _Users Filters
Date Range
Extensions
Types
Contacts
Categories
Tag Types
|
This data set includes results for hormone and pharmaceutical compounds analyzed in environmental and quality-control samples collected by the USGS National Water-Quality Assessment Project during 2013 through 2015 for a study of groundwater resources used for drinking-water supply across the United States. Hormone and pharmaceutical results are provided for environmental samples collected at 1,120 wells or springs; selected ancillary data, such as principal aquifer, well depth, and land-use information also are provided for the sampled sites. The types of quality-control samples included in this data set are blanks, matrix spikes, and replicates collected at field sites or field offices. Included in this data...
Categories: Data;
Types: Map Service,
OGC WFS Layer,
OGC WMS Layer,
OGC WMS Service;
Tags: Cycle 3,
Drinking water,
Environmental Health,
Groundwater,
Hormones,
Water-quality data for groundwater samples collected from 4,824 sites between 1991 through 2018, and ancillary data and information on sampled wells and principal aquifers, were used to assess the occurrence and distribution of strontium in U.S. groundwater from 32 principal aquifers. This data release includes one tab-delimited text file detailing these data. Table: Chemical data from the U.S. Geological Survey National Water Information System and ancillary data considered for assessment of strontium concentration in U.S. groundwater.
Categories: Data;
Types: Map Service,
OGC WFS Layer,
OGC WMS Layer,
OGC WMS Service;
Tags: Hydrology,
NAWQA,
USGS Science Data Catalog (SDC),
Water Quality,
cycle 3,
This dataset contains all the layers associated with U.S. Geological Survey (USGS) Great Lakes Coastal Wetland Restoration Assessment (GLCWRA) initiative for the Upper Peninsula Restoration Assessment (UPRA) which aims to identify and rank coastal areas with the greatest potential for wetland habitat restoration. Each layer has a unique contribution to the identification of restorable wetlands. The 7 parameters (Parameter 0: Mask, Parameter 1: Hydroperiod, Parameter 2: Wetland Soils, Parameter 3: Flowlines, Parameter 4: Conservation and Recreation Lands, Parameter 5: Impervious Surfaces, and Parameter 6: Land Use) and Index Composite directly correlate to areas that are recommended for restoration. The dikes, degree...
Categories: Data Release - Revised;
Types: GeoTIFF,
Map Service,
OGC WFS Layer,
OGC WMS Layer,
OGC WMS Service;
Tags: Chippewa,
Great Lakes,
Holocene,
Lake Huron,
Lake Michigan,
This data set contains shoreline rate of change statistics for New York State coastal wetlands. Analysis was performed using the Digital Shoreline Analysis System (DSAS), created by U.S. Geological Survey, version 5.0, an extension for ArcMap. A reference baseline was used as the originating point for orthogonal transects cast by the DSAS software. The transects intersect each polyline vector shoreline establishing intersection measurement points, which were then used to calculate the rates of change. End-point rates, calculated by dividing the distance of shoreline movement by the time elapsed between the oldest and the most recent shoreline, were generated for wetlands where fewer than three historic shorelines...
Categories: Data;
Types: ArcGIS REST Map Service,
ArcGIS Service Definition,
Downloadable,
Map Service;
Tags: Digital Shoreline Analysis System,
End-Point Rate,
Geography,
Geomorphology,
Great South Bay,
Macroinvertebrate samples were collected from streams tributary to Honnedaga Lake and from the Middle Branch of the Black River during 2012-2016 and analyzed for methylmercury concentrations and for stable isotope ratios of nitrogen and carbon. Macroinvertebrates were identified in the field, and the level of taxonomic resolution varied from order to species; most taxa were identified to the family level. Specimens were field-processed into composite samples, field-frozen, and submitted to the mercury laboratory for freeze-drying and analysis. Subsamples were then submitted to the stable isotope laboratory for analysis of nitrogen and carbon isotope ratios. This database contains the resulting data and associated...
Categories: Data;
Types: Map Service,
OGC WFS Layer,
OGC WMS Layer,
OGC WMS Service;
Tags: Ambient Monitoring,
Aquatic Biology,
Aquatic Community Health,
Ecosystem Health,
Environmental Health,
This data release contains hourly means of climatological data collected by the U.S. Geological Survey (USGS) from 10/1/1991 to 9/30/2019 at three weather stations in the Loch Vale watershed in Rocky Mountain National Park (RMNP), Colorado. In order of increasing elevation, the three weather stations are Loch Vale meteorological station at RMNP, Colo. (Main weather station, USGS station 401719105394311) at an elevation of 2,925 meters (m) above North American Vertical Datum of 1988 (NAVD 88), Andrews Creek meteorological station at RMNP, Colo. (Andrews Creek weather station, USGS station 401723105400101) at an elevation of 2,990 m above NAVD 88 and Sharkstooth meteorological station at RMNP, Colo. (Sharkstooth weather...
Categories: Data;
Types: Downloadable,
Map Service,
OGC WFS Layer,
OGC WMS Layer,
OGC WMS Service,
Shapefile;
Tags: 177847,
Climatology,
Hydrology,
Rocky Mountain National Park,
The Loch,
Daily HOBO Pro V.2 soil temperature measurements at the Great Dismal Swamp National Wildlife Refuge (2015-2017). Data collected in Great Dismal Swamp National Wildlife Refuge in Southern VA and Northern NC from 9 plot sites representing three general forest types: Atlantic White Cedar, Pocosin Pine, and Maple and Gum.
Categories: Data;
Types: Map Service,
OGC WFS Layer,
OGC WMS Layer,
OGC WMS Service;
Tags: Climate,
Great Dismal Swamp National Wildlife Refuge,
Soil Sciences,
USGS Science Data Catalog (SDC),
Wetland
The U.S. Geological Survey (USGS) in cooperation with the Harris‐Galveston Subsidence District, City of Houston, Fort Bend Subsidence District, and Lone Star Groundwater Conservation District has produced this dataset of groundwater‐level altitudes and groundwater‐level altitude changes in the Chicot, Evangeline, and Jasper aquifers in the Houston‐Galveston region, Texas. This dataset shows current‐year (2018) groundwater‐level altitudes for each aquifer, 5‐year (2013‐18) groundwater‐level changes for each aquifer, long‐term (1990‐2018 and 1977‐2018) groundwater‐level changes for the Chicot and Evangeline aquifers, and long‐term (2000‐2018) groundwater‐level change for the Jasper aquifer. The groundwater‐level measurements...
Karst hydrologic systems are important resources in the state of Tennessee both as drinking water resources and as centers for possible biological diversity. These systems are susceptible to contamination due to the inherent connectivity between surface water and groundwater systems in karst systems. A partnership between the U.S. Geological Survey (USGS) and Tennessee Department of Conservation (TDEC) was formed to investigate karst spring systems across the state utilizing fluorescent groundwater tracing, particularly in areas where these resources may be used as drinking water sources. In fall 2021, USGS and TDEC staff identified possible vulnerabilities or complexities that may exist within karst spring systems...
The U.S. Geological Survey (USGS) has been engaged in airborne electromagnetics (AEM) since the 1970s, playing a role in the development of early acquisition systems, developing calibration methods, refining standards for data acquisition, improving data processing, modeling, and interpretation methods, and expanding the range of AEM applications. However, USGS AEM survey visibility and data accessibility has not advanced as rapidly as our use of the technique. This data release catalogs AEM surveys in the United States that have contributed to studies under USGS programs including Water, Geologic Mapping, Minerals, Energy, Environmental Health, Ecosystems, Hazards, and Climate. This dataset contains locations for...
Categories: Data;
Types: ArcGIS REST Map Service,
ArcGIS Service Definition,
Downloadable,
Map Service;
Tags: Alabama,
Arizona,
Arkansas,
California,
Colorado,
Water surface elevations within seven Willamette River off-channel features (OCF; alcoves and side channels) were measured using submerged pressure transducers. Transducers were installed from late May through mid-October, 2016, when discharge of the Willamette River was between approximately 5,500 and 45,000 cubic feet per second at Salem, Oregon (USGS gage 14191000) and 3,500 to 17,500 cubic feet per second at Harrisburg, Oregon (USGS gage 14166000). Pressure transducer sensor depth was measured at all seven sites. For five of the sites, pressure transducer sensor depths were converted to water surface elevations by surveying the water surface at each transducer with a real-time kinematic global positioning system...
Categories: Data;
Types: Citation,
Map Service,
OGC WFS Layer,
OGC WMS Layer,
OGC WMS Service;
Tags: Ecology,
Geomorphology,
Oregon,
RTK,
USGS Science Data Catalog (SDC),
A total of 27 temperature sensors were deployed along the lower 90 miles of the Yakima River at 7 locations where cold water had been previously observed. These 7 cold-water areas had 3 to 6 temperature sensors installed to document the extent and duration of these cold-water areas and their impacts on mainstem temperatures of the Lower Yakima River. Cold-water areas included the mouths of tributaries, alongside channels, and within alcoves. Sensor deployments ranged from 1 to 2 years beginning in October 2018. All temperature data are included in the Yakima.temperatures.zip folder. Details of each monitoring location are provided in the site.locs.csv file. In addition to the raw data and site location information,...
Categories: Data;
Types: Map Service,
OGC WFS Layer,
OGC WMS Layer,
OGC WMS Service;
Tags: Aquatic Biology,
Benton County,
Ecology,
Hydrology,
Richland, WA,
National Land Cover Database (NLCD) 2001 Land Cover Conterminous United States (ver. 2.0, July 2024)
Disclaimer: this is an historic version of NLCD provided for research and citation purposes. Different release dates of NLCD cannot be used with other release dates for correct analysis. Each release of NLCD generates a complete set of directly comparable products. These products must be used together for correct analysis. You can find the latest suite of synced products at www.mrlc.gov. The National Land Cover Database 2001 land cover layer for mapping zones 01-66 was produced through a cooperative project conducted by the Multi-Resolution Land Characteristics (MRLC) Consortium. The MRLC Consortium is a partnership of federal agencies (www.mrlc.gov), consisting of the U.S. Geological Survey (USGS), the National...
Categories: Data Release - Revised;
Types: Map Service,
OGC WFS Layer,
OGC WMS Layer,
OGC WMS Service;
Tags: Base Maps,
Coastal Zone,
Earth Cover,
GIS,
Land Cover,
From 2013 to 2015, bathymetric surveys of New York City’s six West of Hudson reservoirs (Ashokan, Cannonsville, Neversink, Pepacton, Rondout, and Schoharie) were performed to provide updated capacity tables and bathymetric maps. Depths were surveyed with a single-beam echo sounder and real-time kinematic global positioning system (RTK-GPS) along planned transects at predetermined intervals for each reservoir. A separate set of echo sounder data was collected along transects at oblique angles to the main transects for accuracy assessment. Field survey data was combined with water-surface elevations in a geographic information system to create three-dimensional surfaces representing reservoir-bed elevations in the...
Data on 17 metrics of shale gas development in the Pennsylvania portion of the Upper Susquehanna River basin that was collated from a variety of sources and summarized at the upstream catchment scale. Data were also standardized by upstream area and transformed into rank scores based on metric distribution and then summarized into a Disturbance Intensity Index (DII). See Maloney et al. 2018 for detailed descriptions of each data sets and limitations of data. (Maloney, K. O., J. A. Young, S. P. Faulkner, A. Hailegiorgis, E. T. Slonecker, and L. E. Milheim. 2018. A detailed risk assessment of shale gas development on headwater streams in the Pennsylvania portion of the Upper Susquehanna River Basin, U.S.A. Science...
Categories: Data;
Types: Downloadable,
Map Service,
OGC WFS Layer,
OGC WMS Layer,
Shapefile;
Tags: Ecology,
Pennsylvania portion of the Upper Susquehanna River basin,
USGS Science Data Catalog (SDC),
biota,
environment,
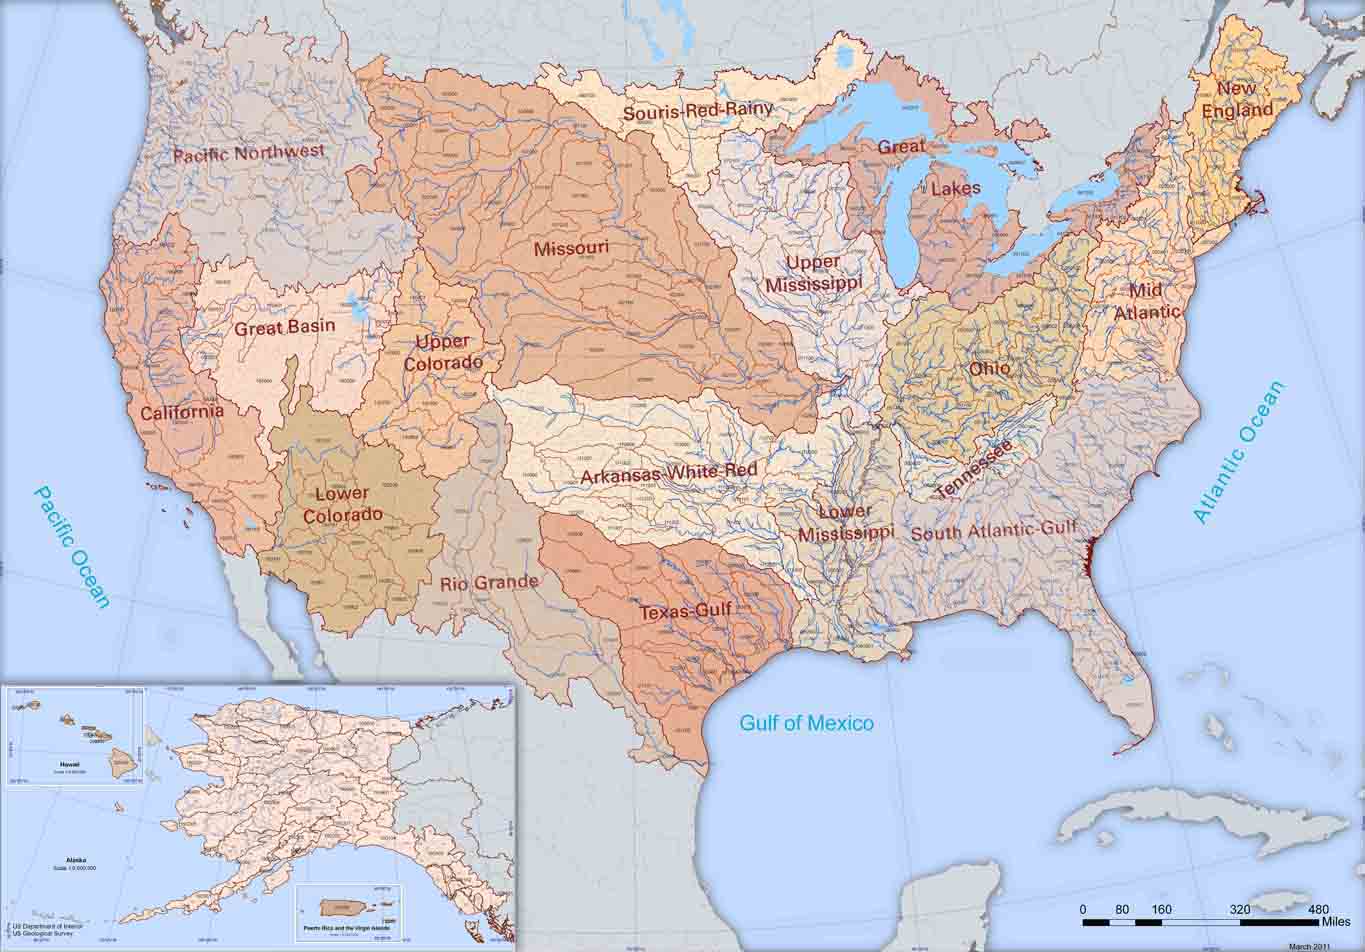
The Watershed Boundary Dataset (WBD) from The National Map (TNM) defines the perimeter of drainage areas formed by the terrain and other landscape characteristics. The drainage areas are nested within each other so that a large drainage area, such as the Upper Mississippi River, will be composed of multiple smaller drainage areas, such as the Wisconsin River. Each of these smaller areas can further be subdivided into smaller and smaller drainage areas. The WBD uses six different levels in this hierarchy, with the smallest averaging about 30,000 acres. The WBD is made up of polygons nested into six levels of data respectively defined by Regions, Subregions, Basins, Subbasins, Watersheds, and Subwatersheds. For additional...
Temporal patterns in glyphosate and atrazine concentrations were measured weekly by the U.S. Geological Survey (USGS) during the 2013 growing season in 100 small streams in the Midwestern United States. Concentrations also were measured every 2 days at a subset of 8 of the sites, all located in Missouri. Glyphosate was detected more frequently in urban streams than in agricultural streams, and at concentrations similar to those in streams with high agricultural land use in the watershed. In contrast, atrazine was detected more frequently and at higher concentrations in agricultural streams than in urban streams. This data release provides watershed characteristics and 2013 glyphosate and atrazine compound concentrations...
Types: Map Service,
OGC WFS Layer,
OGC WMS Layer,
OGC WMS Service;
Tags: Corn Belt,
ELISA,
Illinois,
Indiana,
Iowa,
In the fall of 2014 (October-November) the U.S. Geological Survey in cooperation with the U.S. Army Corps of Engineers collected sediment samples (suspended and bed material) at several sites on the Niobrara River in Nebraska near the Spencer Dam prior to, during, and immediately after a sediment-flushing event. Suspended-sediment samples were analyzed for sediment concentration and percent finer than sand. Bed sediment samples were analyzed for particle-size distribution using standard classes by sieve analysis. In addition, a Sequoia LISST Streamside particle-size analyzer (PSA) was deployed during the first week of the flush; this unit collected suspended-sediment concentration and grain-size data. Sampled sites...
Categories: Data;
Types: Map Service,
OGC WFS Layer,
OGC WMS Layer,
OGC WMS Service;
Tags: Nebraska,
Niobrara River,
Niobrara River,
Spencer Dam,
USGS Science Data Catalog (SDC),
This dataset provides an estimate of 2015 cheatgrass percent cover in the northern Great Basin at 250 meter spatial resolution. The dataset was generated by integrating eMODIS NDVI satellite data with independent variables that influence cheatgrass germination and growth into a regression-tree model. Individual pixel values range from 0 to 100 with an overall mean value of 9.85 and a standard deviation of 12.78. A mask covers areas not classified as shrub/scrub or grass/herbaceous by the 2001 National Land Cover Database. The mask also covers areas higher than 2000 meters in elevation because cheatgrass is unlikely to exist at more than 2% cover above this threshold. Cheatgrass is an invasive grass that has invaded...
Categories: Data;
Types: ArcGIS REST Map Service,
ArcGIS Service Definition,
Downloadable,
Map Service;
Tags: Bromus tectorum,
Cheatgrass,
MODIS,
NDVI,
Northwest CASC,
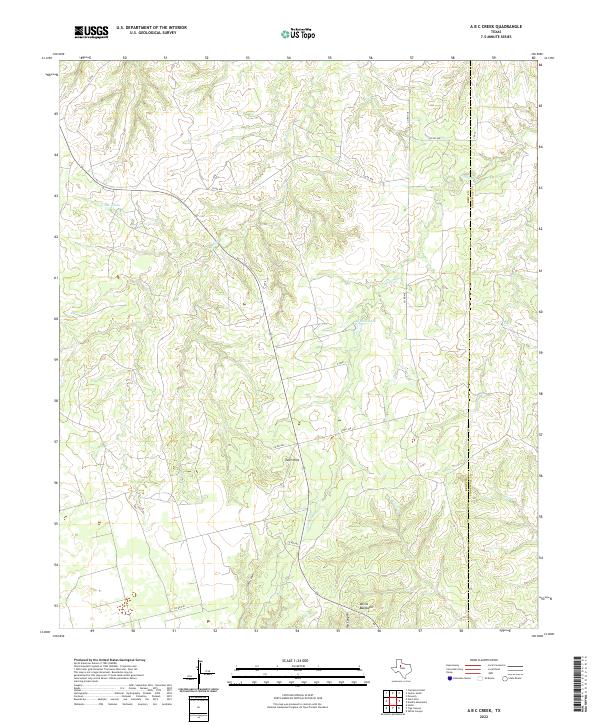
Layered geospatial PDF 7.5 Minute Quadrangle Map. Layers of geospatial data include orthoimagery, roads, grids, geographic names, elevation contours, hydrography, boundaries, and other selected map features. This map depicts geographic features on the surface of the earth. One intended purpose is to support emergency response at all levels of government. The geospatial data in this map are from selected National Map data holdings and other government sources.
Categories: Collection;
Types: Map Service,
OGC WFS Layer,
OGC WMS Layer,
OGC WMS Service;
Tags: Public Land Survey System,
U.S. National Grid,
US,
USGS:6d94af68-1f05-4f9e-9b5a-63f7a05d258b,
United States,
|

|
