Folders: ROOT > ScienceBase Catalog > LC MAP - Landscape Conservation Management and Analysis Portal > North Pacific Landscape Conservation Cooperative > Data Inventory ( Show direct descendants )
823 results (21ms)
Location
Folder
ROOT _ScienceBase Catalog __LC MAP - Landscape Conservation Management and Analysis Portal ___North Pacific Landscape Conservation Cooperative ____Data Inventory Filters
Date Range
Extensions
Types
Contacts
Categories Tag Types
|
This set of files includes downscaled projections of decadal means of seasonal total precipitation (in millimeters, no unit conversion necessary) for each season of every decade from 2010 - 2100 (see exceptions below) at 771x771 meter spatial resolution. Each file represents a mean seasonal total in a given decade. The four seasons are referred to by the first letter of 3 months making up that season. JJA=summer SON=fall DJF=winter MAM=spring The spatial extent includes Alaska. ========= Overview: Most of SNAP’s climate projections come in multiple versions. There are 5 climate models, one 5 model average, 3 climate scenarios, 12 months, and 100 years. This amounts to 21,600 files per variable for monthly data....
This set of files includes downscaled projections of decadal means of annual length of growing season (numbers of days, 0-365) for each decade from 2010 - 2100 (see exceptions below) at 2x2 kilometer spatial resolution. Each file represents a decadal mean of an annual mean calculated from mean monthly data. The spatial extent includes Alaska, the Yukon Territories, British Columbia, Alberta, Saskatchewan, and Manitoba. ========= Overview: Most of SNAP’s climate projections come in multiple versions. There are 5 climate models, one 5 model average, 3 climate scenarios, 12 months, and 100 years. This amounts to 21,600 files per variable for monthly data. Some datasets are derived products such as monthly decadal...
This is a photo-interpreted vegetation layer that is more detailed and done to higher more consistent standard than the forestwide vegetation layer (vege).Forest land is typed to a 5 acre minimum for federal and state ownership, 20 acre for private.
Existing Vegetation stands and non-forest areas. Latest spatial edits were completed 2/11/2008.
Ecoregional assessments provide a regional scale, biodiversity-based context forimplementing conservation efforts. The intent of the assessments is to create a sharedvision for agencies and other organizations at the regional, state and local levels to formpartnerships and ensure efficient allocation of conservation resources. The assessments identify a portfolio of sites for conservation action with a goal of protecting representativebiodiversity and ecologically significant populations. These assessments are the result ofrigorous analysis, incorporating expert review, and are the most comprehensive and currentefforts that support spatially explicit priority setting at an ecoregional scale. Biodiversityconservation...
Climate data (NCEP: Average Annual Total Precipitation, 1968-1999) have been generated using a regional climate model called RegCM3 using boundary conditions from observations or general circulation models for historical conditions, and from GCM projections for future conditions. Regional climate model description: RegCM3 is the third generation of the Regional Climate Model originally developed at the National Center for Atmospheric Research during the late 1980s and early 1990s. Details on current model components and applications of the model can be found in numerous publications (e.g., Giorgi et al, 2004a,b, Pal et al, 2007), the ICTP RegCNET web site (http://users.ictp.it/RegCNET/model.html), and the ICTP...
Percent change in the average C3 grass fraction (a biogeographic index based on the ratio of C3 to C4 grass) for each HUC5 watershed between historical (1971-2000) and future (2071-2100) time periods. The MC1 dynamic vegetation model was run under the CSIRO, MIROC, and Hadley climate change projections and the A2 anthropogenic emissions scenario. Simulated mean C3 grass fraction was determined for each HUC5 watershed. Watersheds represent 5th level (HUC5, 10-digit) hydrologic unit boundaries and were acquired from the Natural Resources Conservation Service. Background: The dynamic global vegetation model MC1 (see Bachelet et al. 2001) was used to simulate vegetation dynamics, associated carbon and nitrogen...
This dataset depicts the Difference for Total Average Annual Precipitation for 2015-2030 and 2045-2060 compared to 1968-1999 for GENMOM. These data have been generated using a regional climate model called RegCM3 using boundary conditions from observations or general circulation models for historical conditions, and from GCM projections for future conditions. Regional climate model description: RegCM3 is the third generation of the Regional Climate Model originally developed at the National Center for Atmospheric Research during the late 1980s and early 1990s. Details on current model components and applications of the model can be found in numerous publications (e.g., Giorgi et al, 2004a,b, Pal et al, 2007),...
SLAMM-View is a web browser-based application that provides tools for improved understanding of results from research projects that employ the Sea Level Affecting Marshes Model (SLAMM). Version 2.0 of SLAMM-View was designed for a user-friendly, workflow-based approach to assess impacts of sea-level rise (SLR) on coastal areas with both visualization and analysis functionality. SLAMM-View provides simultaneous comparison between both current and future conditions out to the year 2100, and among different SLR scenarios (e.g., 0.4 meter vs. 1 meter), using interactive maps and tabular reporting capabilities. To date, SLAMM-View provides access to SLAMM simulation results for the entire coastlines of 5 states, and...
Tree Height Buffer distances for riparian management area analysis. These data provide both single and double tree height based buffer distances across the WOPR area. Tree height values have been adjusted for average slope adjacent to streams on BLM lands, by watershed. Separate values for perennial versus intermittent hydrologic features are provided. All buffer disances are in meters. BLM ( Bureau of Land Management) WOPR (Western Oregon Plan Revision) WOPR Purpose: A (Analysis) PRMP: Proposed Resource Management Plan RMA: Riparian Management Areas
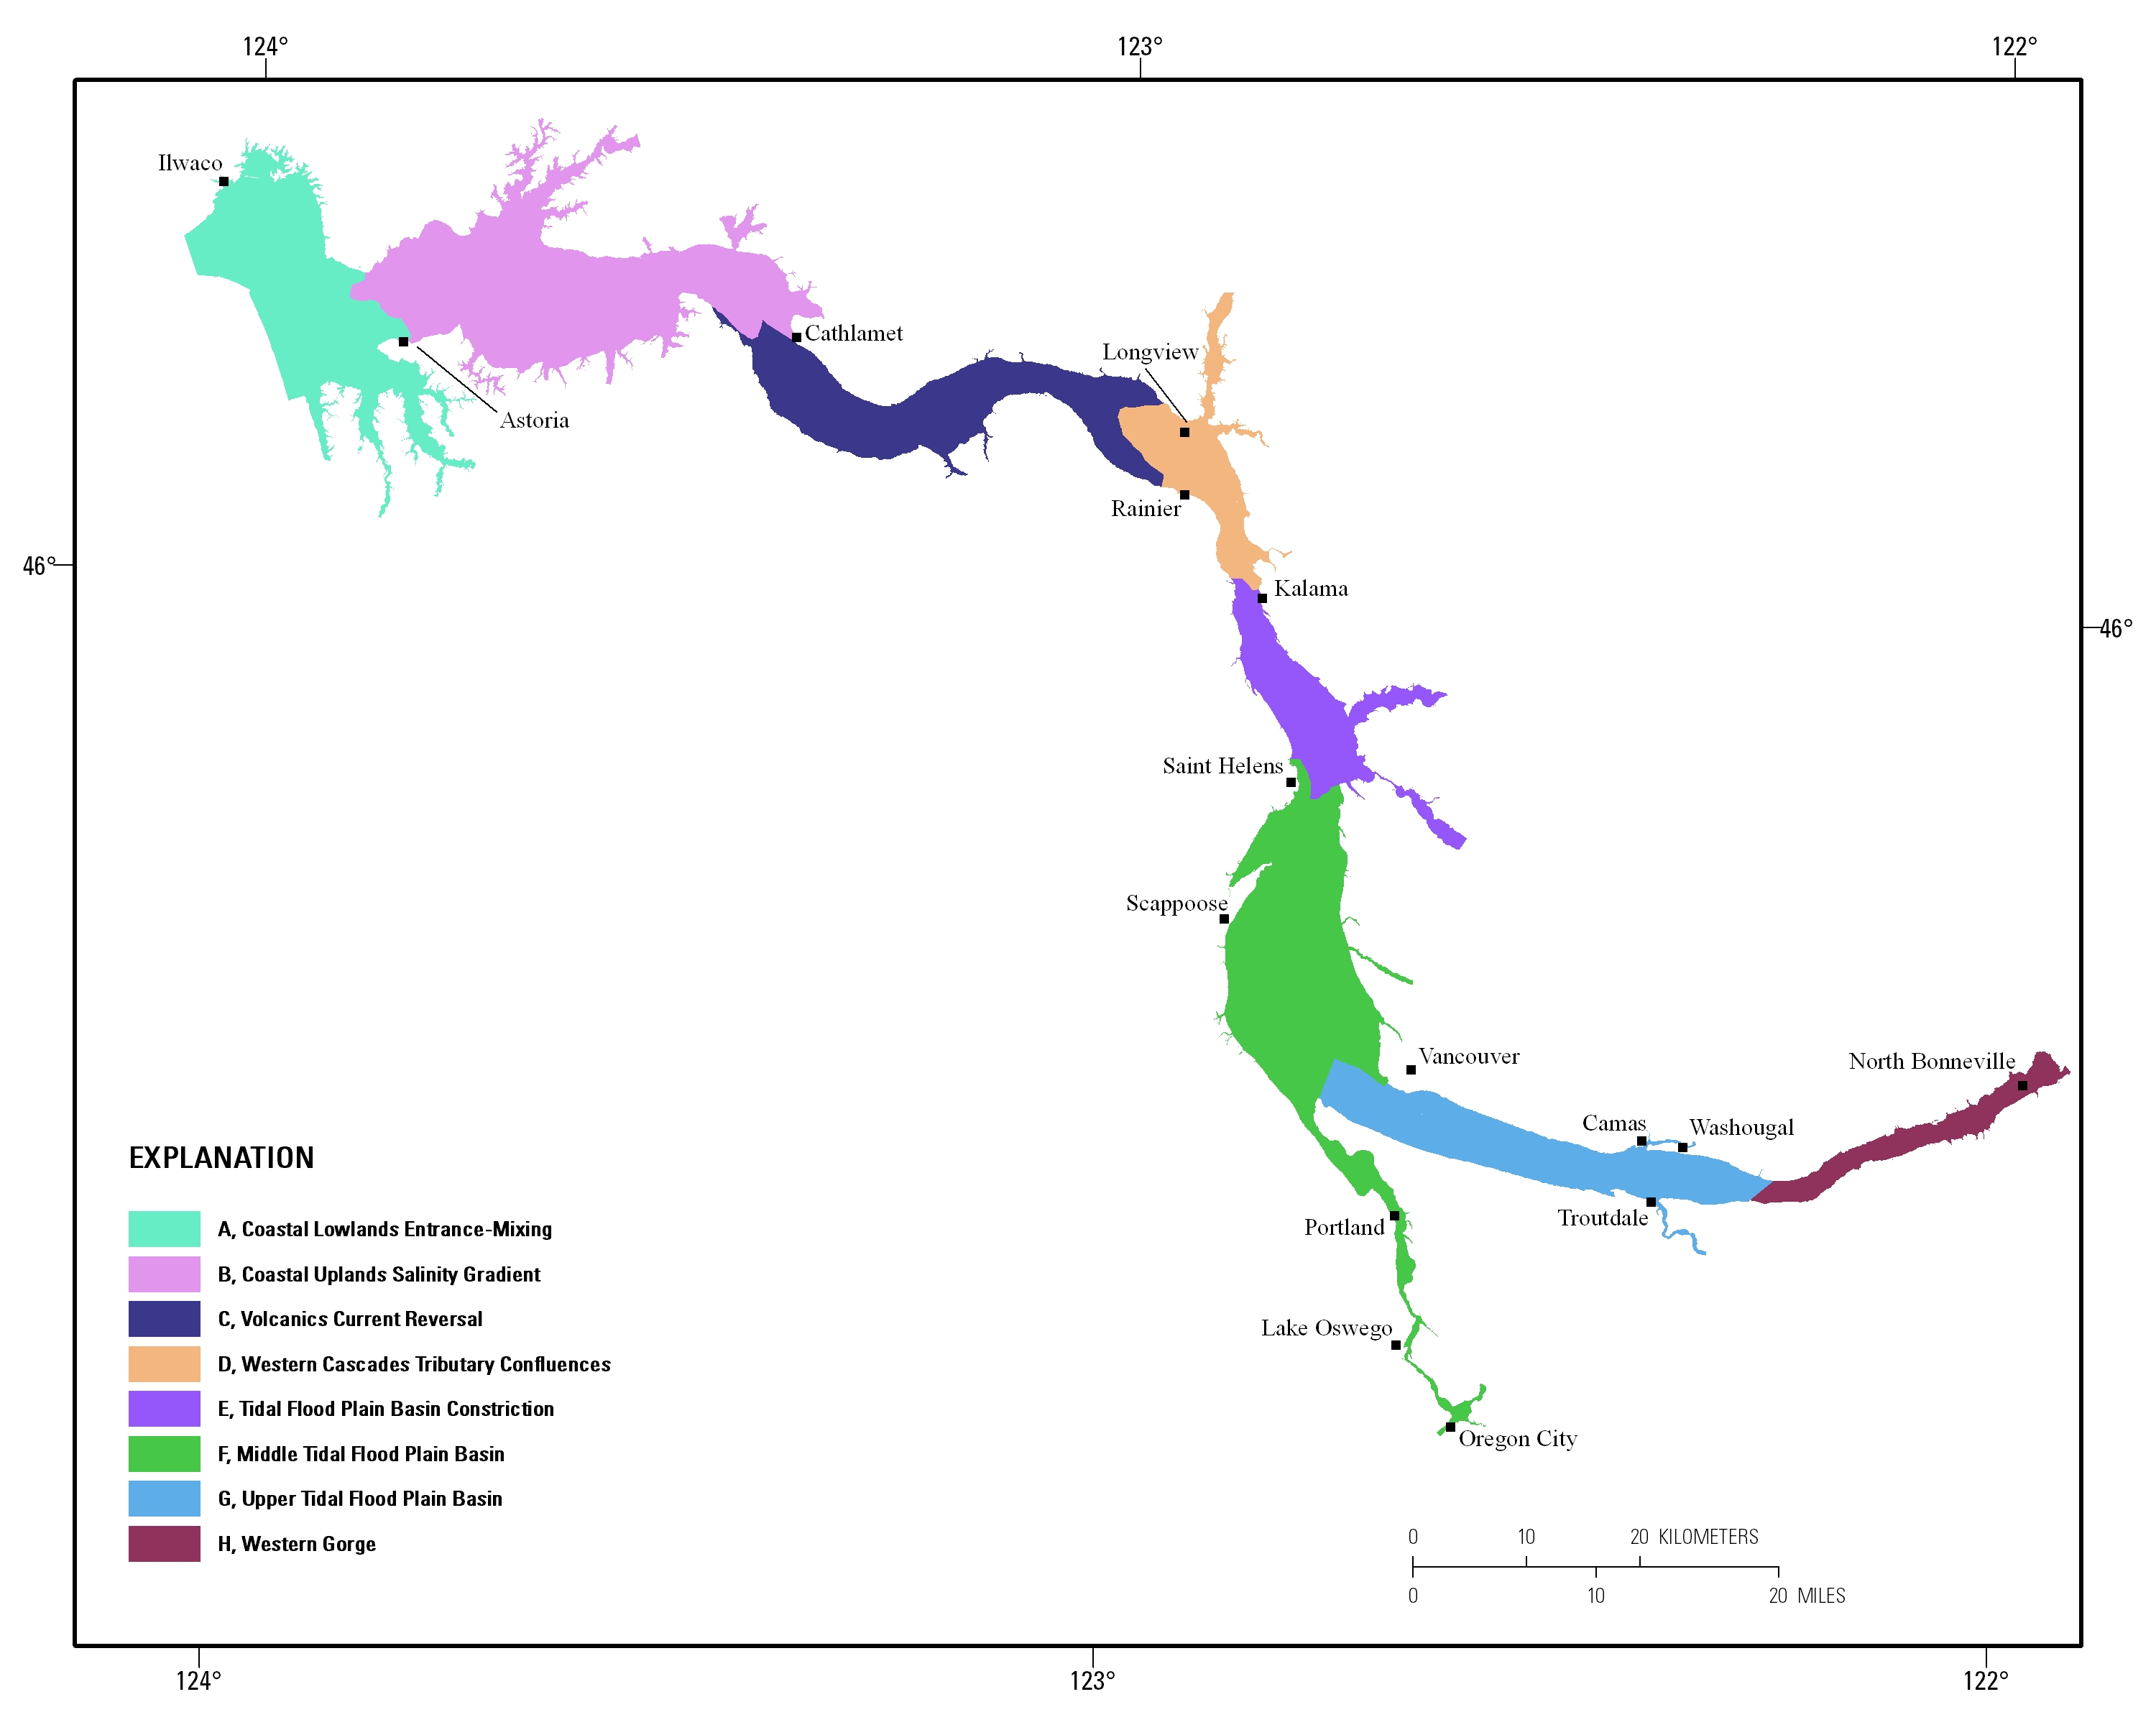
Estuarine ecosystems are controlled by a variety of processes that operate at multiple spatial and temporal scales. Understanding the hierarchical nature of these processes will aid in prioritization of restoration efforts. This hierarchical Columbia River Estuary Ecosystem Classification (henceforth "Classification") of the Columbia River estuary is a spatial database of the tidally-influenced reaches of the lower Columbia River, the tidally affected parts of its tributaries, and the landforms that make up their floodplains for the 230 kilometers between the Pacific Ocean and Bonneville Dam. This work is a collaborative effort between University of Washington School of Aquatic and Fishery Sciences (henceforth "UW"),...
“Under section 303(d) of the 1972 Clean Water Act, states, territories, and authorized tribes are required to develop lists of impaired waters. These impaired waters do not meet water quality standards that states, territories, and authorized tribes have set for them, even after point sources of pollution have installed the minimum required levels of pollution control technology. The law requires that these jurisdictions establish priority rankings for waters on the lists and develop TMDLs for these waters” (U.S. Environmental Protection Agency, 2011). Waterways represented in this data set are a subset of these EPA 303 (d) listed streams that were classified as nutrient impaired. Nutrient impaired streams include...
Trout Unlimited developed the Conservation Success Index (CSI) in order to become more strategic and effective in our conservation efforts. Using the CSI, we can quantify and map the conservation status of all native coldwater fishes so that comparisons of existing condition, threats, future security, and management opportunities can be made across watersheds, river basins, and entire species. This enables us to deliver conservation in context. The CSI integrates population data from various assessments completed by state and federal agencies with spatial data on habitat and threats gathered by TU scientists to create a common analytical framework applicable to all coldwater fishes. The basic components of...
Annual average offshore wind speed for the Pacific Coast (California, Oregon, and Washington) at a 90 meter height. Available from NREL at http://www.nrel.gov/renewable_resources/ . This version was last updated on 8/23/2010.
This dataset represents freshwater streams on the Chugach National Forest, Alaska. Streams were digitized from 1:31,380 orthophoto quads. Estuarine channel types may extend beyond shoreline. Selected stream arcs on Cordova Ranger District updated October and November 2002. Presence of fish species and stream class were updated.
The Renewable Energy Atlas is an interactive application of the renewable energy resources in the contiguous United States, Alaska and Hawaii. It illustrates the geographic distribution of wind, solar, geothermal, and biomass resources, as well as other pertinent information such as transportation network and administrative boundaries. The Atlas is for anyone interested in renewable energy in the country, including researchers, developers, and policy makers.
Grizzly Bear / Wolverine Management Priorities for the Squamish Forest District; ranked high, medium and low.
|

|
