Folders: ROOT > ScienceBase Catalog > USGS Collections ( Show direct descendants )
72 results (37ms)
Location
Folder
ROOT _ScienceBase Catalog __USGS Collections Filters
Date Range
Extensions Types
Contacts
Categories Tag Types
|
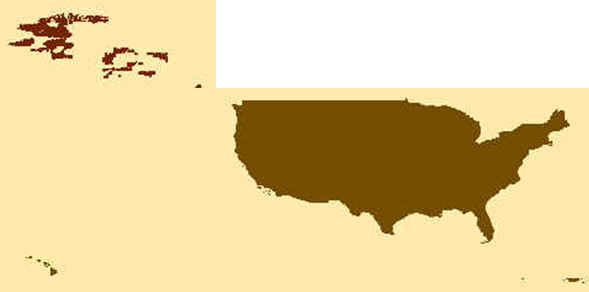
These vector contour lines are derived from the 3D Elevation Program using automated and semi-automated processes. They were created to support 1:24,000-scale CONUS and Hawaii, 1:25,000-scale Alaska, and 1:20,000-scale Puerto Rico / US Virgin Island topographic map products, but are also published in this GIS vector format. Contour intervals are assigned by 7.5-minute quadrangle, so this vector dataset is not visually seamless across quadrangle boundaries. The vector lines have elevation attributes (in feet above mean sea level on NAVD88), but this dataset does not carry line symbols or annotation
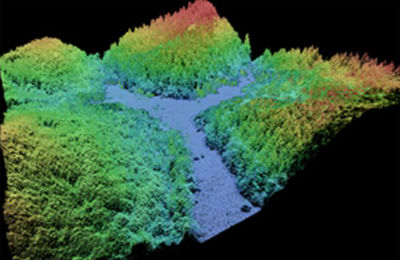
This data collection of the 3D Elevation Program (3DEP) consists of Lidar Point Cloud (LPC) projects as provided to the USGS. These point cloud files contain all the original lidar points collected, with the original spatial reference and units preserved. These data may have been used as the source of updates to the 1/3-arcsecond, 1-arcsecond, and 2-arcsecond seamless 3DEP Digital Elevation Models (DEMs). The 3DEP data holdings serve as the elevation layer of The National Map, and provide foundational elevation information for earth science studies and mapping applications in the United States. Lidar (Light detection and ranging) discrete-return point cloud data are available in LAZ format. The LAZ format is a lossless...
The ANSS Backbone Network is based on the core of the original US National Seismic Network. In partnership with the National Science Foundation, the USGS worked with the Earthscope program (through the USArray project and IRIS) in 2004-2006 to upgrade and install new backbone stations. This effort was completed in September 2006, with 15 new stations installed and 20 existing stations upgraded. Today, the ANSS Backbone consists of nearly 100 stations in the United States, many of them contributed by partner networks and organizations.
This dataset combines the work of several different projects to create a seamless data set for the contiguous United States. Data from four regional Gap Analysis Projects and the LANDFIRE project were combined to make this dataset. In the northwestern United States (Idaho, Oregon, Montana, Washington and Wyoming) data in this map came from the Northwest Gap Analysis Project. In the southwestern United States (Colorado, Arizona, Nevada, New Mexico, and Utah) data used in this map came from the Southwest Gap Analysis Project. The data for Alabama, Florida, Georgia, Kentucky, North Carolina, South Carolina, Mississippi, Tennessee, and Virginia came from the Southeast Gap Analysis Project and the California data was...
The 2008 U.S. Geological Survey (USGS) National Seismic Hazard Maps display earthquake ground motions for various probability levels across the United States and are applied in seismic provisions of building codes, insurance rate structures, risk assessments, and other public policy. This update of the maps incorporates new findings on earthquake ground shaking, faults, seismicity, and geodesy. The resulting maps are derived from seismic hazard curves calculated on a grid of sites across the United States that describe the frequency of exceeding a set of ground motions. The USGS National Seismic Hazard Mapping Project developed these maps by incorporating information on potential earthquakes and associated ground...
Types: Citation;
Tags: B/C site class boundary,
EHP,
Earthquake Hazards Program,
GHSC,
Geologic Hazards Science Center,
Collection of metadata records for marquee datasets/data systems of the Core Science Analytics and Synthesis Program.
Categories: Collection;
Tags: USGS Science Data Catalog (SDC)
PAGER (Prompt Assessment of Global Earthquakes for Response) is an automated system that estimates the impact of significant earthquakes around the world, informing emergency responders, government and aid agencies, and the media of the scope of the potential disaster. PAGER rapidly assesses earthquake impacts by comparing the population exposed to each estimated shaking intensity level with models of economic and fatality losses based on past earthquakes in each country or region of the world. PAGER sends out alerts based on the estimated range of fatalities and economic losses.
Types: Citation;
Tags: ANSS,
Advanced National Seismic System,
ComCat,
Comprehensive Earthquake Catalog,
Earth,
In response to the need and an intergovernmental commission for a high resolution and data-derived global ecosystem map, land surface elements of global ecological pattern were characterized in an ecophysiographic stratification of the planet. The stratification produced 3,923 terrestrial ecological land units (ELUs) at a base resolution of 250 meters. The ELUs were derived from data on land surface features in a three step approach. The first step involved acquiring or developing four global raster datalayers representing the primary components of ecosystem structure: bioclimate, landform, lithology, and land cover. These datasets generally represent the most accurate, current, globally comprehensive, and finest...
The USA National Phenology Network has available a series of gridded products enabling researchers to analyze historical and contemporary data related to the Extended Spring Indices. The Extended Spring Indices are mathematical models that predict the "start of spring" (timing of leaf out or bloom for species active in early spring) at a particular location (Schwartz 1997, Schwartz et al. 2006, Schwartz et al. 2013). These models were constructed using historical observations of the timing of first leaf and first bloom in a cloned lilac cultivar (S. x chinensis 'Red Rothomagensis') and two cloned honeysuckle cultivars (Lonicera tatarica 'Arnold Red' and L. korolkowii 'Zabelii'). Primary inputs to the model are temperature...
Types: Citation,
Map Service,
OGC WFS Layer,
OGC WMS Layer,
OGC WMS Service;
Tags: ecology,
phenology
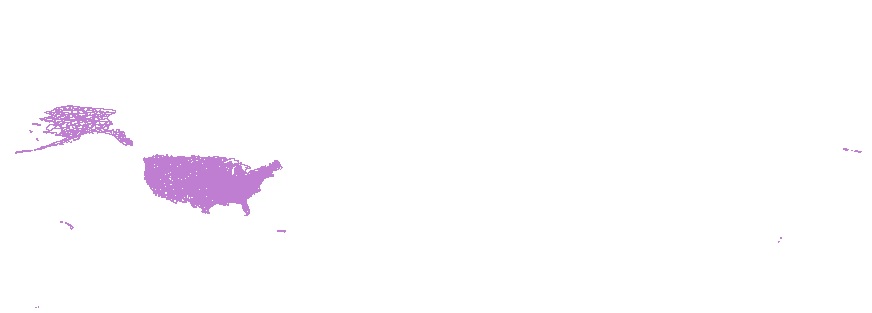
The Watershed Boundary Dataset (WBD) is a comprehensive aggregated collection of hydrologic unit data consistent with the national criteria for delineation and resolution. It defines the areal extent of surface water drainage to a point except in coastal or lake front areas where there could be multiple outlets as stated by the "Federal Standards and Procedures for the National Watershed Boundary Dataset (WBD)" "Standard" (https://pubs.usgs.gov/tm/11/a3/). Watershed boundaries are determined solely upon science-based hydrologic principles, not favoring any administrative boundaries or special projects, nor particular program or agency. This dataset represents the hydrologic unit boundaries to the 12-digit for the...
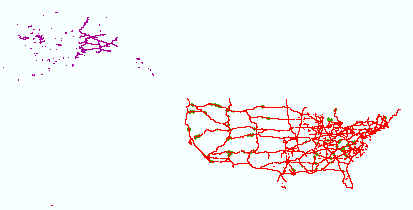
The USGS Transportation downloadable data from The National Map (TNM) is based on TIGER/Line data provided through U.S. Census Bureau and supplemented with HERE road data to create tile cache base maps. Some of the TIGER/Line data includes limited corrections done by USGS. Transportation data consists of roads, railroads, trails, airports, and other features associated with the transport of people or commerce. The data include the name or route designator, classification, and location. Transportation data support general mapping and geographic information system technology analysis for applications such as traffic safety, congestion mitigation, disaster planning, and emergency response. The National Map transportation...
The U.S. Geological Survey (USGS) has generated and mapped isobioclimate classes for the contiguous United States. These isobioclimate classes were created as part of an effort to map standardized, terrestrial ecosystems for the nation using a classification developed by NatureServe (Comer and others, 2003). Ecosystem distributions were modeled using a biophysical stratification approach developed for South America (Sayre and others, 2008) and now being implemented globally (Sayre and others, 2007). Bioclimate regimes strongly influence the differentiation and distribution of terrestrial ecosystems, and are one of the key input layers in the ecosystem delineation process.The Rivas-Martínez methodology used to produce...
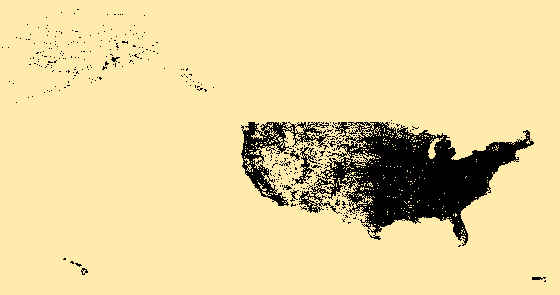
USGS Structures from The National Map (TNM) consists of data to include the name, function, location, and other core information and characteristics of selected manmade facilities across all US states and territories. The types of structures collected are largely determined by the needs of disaster planning and emergency response, and homeland security organizations. Structures currently included are: School, School:Elementary, School:Middle, School:High, College/University, Technical/Trade School, Ambulance Service, Fire Station/EMS Station, Law Enforcement, Prison/Correctional Facility, Post Office, Hospital/Medical Center, Cabin, Campground, Cemetery, Historic Site/Point of Interest, Picnic Area, Trailhead, Vistor/Information...

MARIS is an internet-based information sharing network that allows multiple states to provide a common set of variables via a single web interface. MARIS is not a "dataset" but rather links specific content of multiple states' datasets. MARIS does not capture all of the information from each state's aquatic dataset only a subset of data collected as part of aquatic species sampling surveys. The MARIS structure was developed by a consortium of state fish and wildlife agencies and implemented through contracts with various universities. In the past, federal agency partners have provided the core funding for developing and implementing MARIS as well as broad guidance on the content of the system. In 2014 the U.S. Geological...
These data were released prior to the October 1, 2016 effective date for the USGS’s policy dictating the review, approval, and release of scientific data as referenced in USGS Survey Manual Chapter 502.8 Fundamental Science Practices: Review and Approval of Scientific Data for Release. The U.S. Geological Survey (USGS) modeled the distribution of terrestrial ecosystems for the contiguous United States using a standardized, deductive approach to associate unique physical environments with ecological systems characterized in NatureServe's Ecological Systems of the United States classification (Comer et al., 2003). This approach was first developed for South America (Sayre et al., 2008) and is now being implemented...
Categories: Data;
Tags: GEO,
GEOSS,
Geological Survey,
Global Earth Observation System of Systems,
Group on Earth Observations,
The U.S. Geological Survey (USGS) has generated topographic moisture potential classes for the contiguous United States. These topographic moisture potential classes were created as part of an effort to map standardized, terrestrial ecosystems for the nation using a classification developed by NatureServe (Comer and others, 2003). Ecosystem distributions were modeled using a biophysical stratification approach developed for South America (Sayre and others, 2008) and now being implemented globally (Sayre and others, 2007). Substrate moisture regimes strongly influence the differentiation and distribution of terrestrial ecosystems, and are one of the key input layers in the ecosystem delineation process. The method...
Gap Analysis Project (GAP) habitat maps are predictions of the spatial distribution of suitable environmental and land cover conditions within the United States for individual species. Mapped areas represent places where the environment is suitable for the species to occur (i.e. suitable to support one or more life history requirements for breeding, resting, or foraging), while areas not included in the map are those predicted to be unsuitable for the species. While the actual distributions of many species are likely to be habitat limited, suitable habitat will not always be occupied because of population dynamics and species interactions. Furthermore, these maps correspond to midscale characterizations of landscapes,...
Categories: Data,
Map;
Types: Map Service,
OGC WFS Layer,
OGC WMS Layer,
OGC WMS Service;
Tags: Biodiversity and Ecosystems Theme,
NGDA,
National Geospatial Data Asset,
USGS Science Data Catalog (SDC),
United States,
The U.S. Geological Survey’s Wetland and Aquatic Research Center (WARC), formed in 2015, pulls together experts in biology and ecology from around the Southeastern United States and Caribbean. With primary locations in Lafayette, Louisiana, and Gainesville, Florida, WARC scientists pursue relevant and objective research and new approaches and technologies, to build scientific knowledge and provide understanding and tools for wise management and conservation of wetlands and aquatic ecosystems and their associated plant and animal communities throughout the nation and the world, with an emphasis on the Southeast United States, the Caribbean, and the Gulf of Mexico. Beyond the primary centers, research facilities...
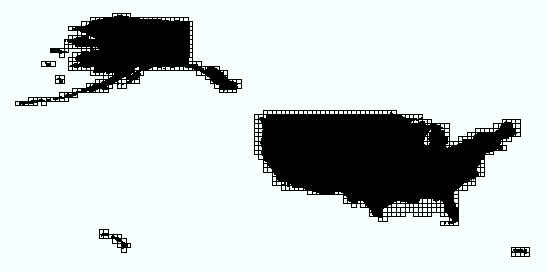
This data consists of data grids for the United States, including 1 X 2 Degree, 1 X 1 Degree, 30 X 60 Minute, 15 X 15 Minute, 7.5 X 7.5 Minute, and 3.75 X 3.75 Minute, along with custom-sized products, where a traditionally-published map exists. The grid was generated using ESRI ArcGIS Pro software. The grids represent the extent of topographic maps published by the USGS.
|

|