Filters: Tags: {"type":"Place","name":"texas"} (X)
37,460 results (129ms)|
Filters
Date Range
Extensions
Types
Contacts
Categories Tag Schemes
|
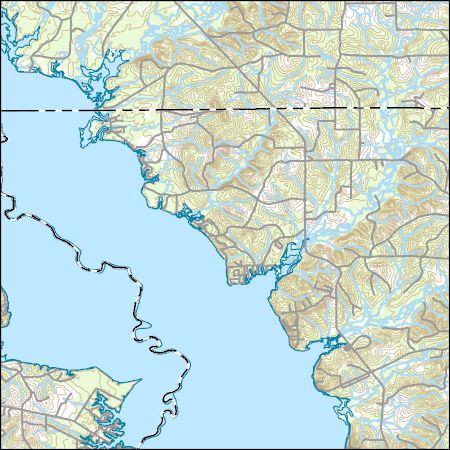
Layers of geospatial data include contours, boundaries, land cover, hydrography, roads, transportation, geographic names, structures, and other selected map features.
Types: Citation;
Tags: 7.5 x 7.5 minute,
7.5 x 7.5 minute,
Combined Vector,
Combined Vector,
Combined Vector,
Field spikes were prepared at 207 stream and river sites as part of the U.S. Geological Survey (USGS) National Water Quality Assessment (NAWQA) project between December, 2012, and September, 2015. At the field site, a depth-and width-integrated environmental sample was collected, and one subsample of the environmental sample was spiked with a known amount of a spike mixture. Both the spiked subsample ("spike sample") and another subsample ("environmental sample") of the original water sample were analyzed for pesticides at the USGS National Water Quality Laboratory (NWQL) by direct injection liquid chromatography with tandem mass spectrometry (LC-MS/MS), and were used to calculate the spike recovery of each analyte....
This dataset contains chemical and isotopic data from 39 produced water samples collected from sealed separators containing water from horizontal hydrocarbon wells in the lower Eagle Ford Group. The samples were collected from Lavaca and Gonzales counties, Texas in December, 2015. All wells had been in production for longer than 6 months and had produced more than 10,000 barrels (~160,000 liters) of water.
Categories: Data;
Tags: Energy Resources,
Texas,
USGS Science Data Catalog (SDC),
geochemistry,
groundwater geochemistry,

This map layer consists of federally owned or administered lands of the United States, Puerto Rico, and the U.S. Virgin Islands. For the most part, only areas of 320 acres or more are included; some smaller areas deemed to be important or significant are also included. There may be private inholdings within the boundaries of Federal lands in this map layer. Some established Federal lands which are larger than 320 acres are not included in this map layer, because their boundaries were not available from the owning or administering agency.
Sediment samples and samples for water-toxicity testing were collected during 2014 from several streams in San Antonio, Texas known locally as the Westside creeks (Alazán, Apache, Martínez, and San Pedro Creeks) and from the San Antonio River. Samples were collected once during base-flow and again after periods of storm-water runoff (post-storm conditions) to determine baseline sediment- and water-quality conditions. Streambed-sediment samples were analyzed for selected constituents, including trace elements and organic contaminants such as pesticides, polychlorinated biphenyls (PCBs), brominated flame retardants, and polycyclic aromatic hydrocarbons (PAHs).
Categories: Data;
Tags: Alazán Creek,
Apache Creek,
Bexar County,
Brominated flame retardants,
Fathead minnow,
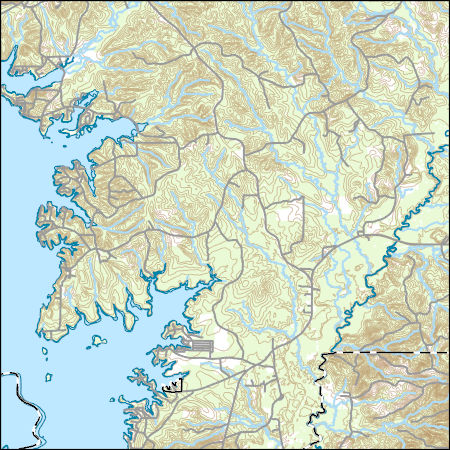
Layers of geospatial data include contours, boundaries, land cover, hydrography, roads, transportation, geographic names, structures, and other selected map features.
Layers of geospatial data include contours, boundaries, land cover, hydrography, roads, transportation, geographic names, structures, and other selected map features.
Types: Citation;
Tags: 7.5 x 7.5 minute,
7.5 x 7.5 minute,
Beauregard County,
Combined Vector,
Combined Vector,
This dataset provides timeseries data on water quality and quantity, as collected or computed from outside sources. The format is many tables with one row per time series observation (1 tab-delimited file per site-variable combination, 1 zip file per site). This compilation of data is intended for use in estimating or interpreting metabolism. Sites were included if they met the initial criteria of having at least 100 dissolved oxygen observations and one of the accepted NWIS site types ('ST','ST-CA','ST-DCH','ST-TS', or 'SP'). This dataset is part of a larger data release of metabolism model inputs and outputs for 356 streams and rivers across the United States (https://doi.org/10.5066/F70864KX). The complete release...
In cooperation with the Texas Commission on Environmental Quality (TCEQ), the U.S. Geological Survey (USGS) utilized various field and laboratory methods to determine the presence and concentration of cyanobacteria, cyanotoxins, and taste-and-odor compounds in Texas water bodies. This data release documents the results from water-quality samples collected from 41 water bodies in Texas during 2016–19. Both qualitative and quantitative field and laboratory methods were performed. Analyses included phytoplankton taxonomy, measurements of phytoplankton biomass, and concentrations of cyanotoxins, taste-and-odor compounds, and photosynthetic pigments. Water-quality samples were also collected to provide supporting data...
This geodatabase contains the official boundary of the Southeast Aquatic Resource Partnership with State Boundaries. The boundary was originally developed by the United States Fish and Wildlife Service and was updated in 2020 to reflect revisions from the Southeast Aquatic Resource Partnership, a recognized Fish Habitat Partnership (FHP) of the National Fish Habitat Partnership.
Categories: Data;
Types: ArcGIS REST Map Service,
ArcGIS Service Definition,
Downloadable,
Map Service;
Tags: Alabama,
Analytical boundary,
Aquatic habitats,
Boundaries,
Boundary,
These data were collected as part of a field trial to test the effectiveness of a sylvatic plague vaccine (see Rocke et al., 2017 for details). Vaccine and control plots were selected randomly from the available pairs at each location. Baits containing Rhodamine B, a biomarker, were distributed at each plot. At least 1 week and no more than 2 months post-baiting each year, local collaborators captured, marked, and sampled prairie dogs. Hair and whisker samples were collected from up to 50 unique prairie dogs from each plot each year. Sex, age, weight, and the identity of all current-year and prior-year recaptures were recorded for each captured animal. In the laboratory, hair/whiskers were assessed for the presence...
Categories: Data;
Types: Map Service,
OGC WFS Layer,
OGC WMS Layer,
OGC WMS Service;
Tags: Arizona,
Awapa Plateau,
Buffalo Gap National Grasslands,
Cedar City,
Charles M. Russell National Wildlife Refuge,
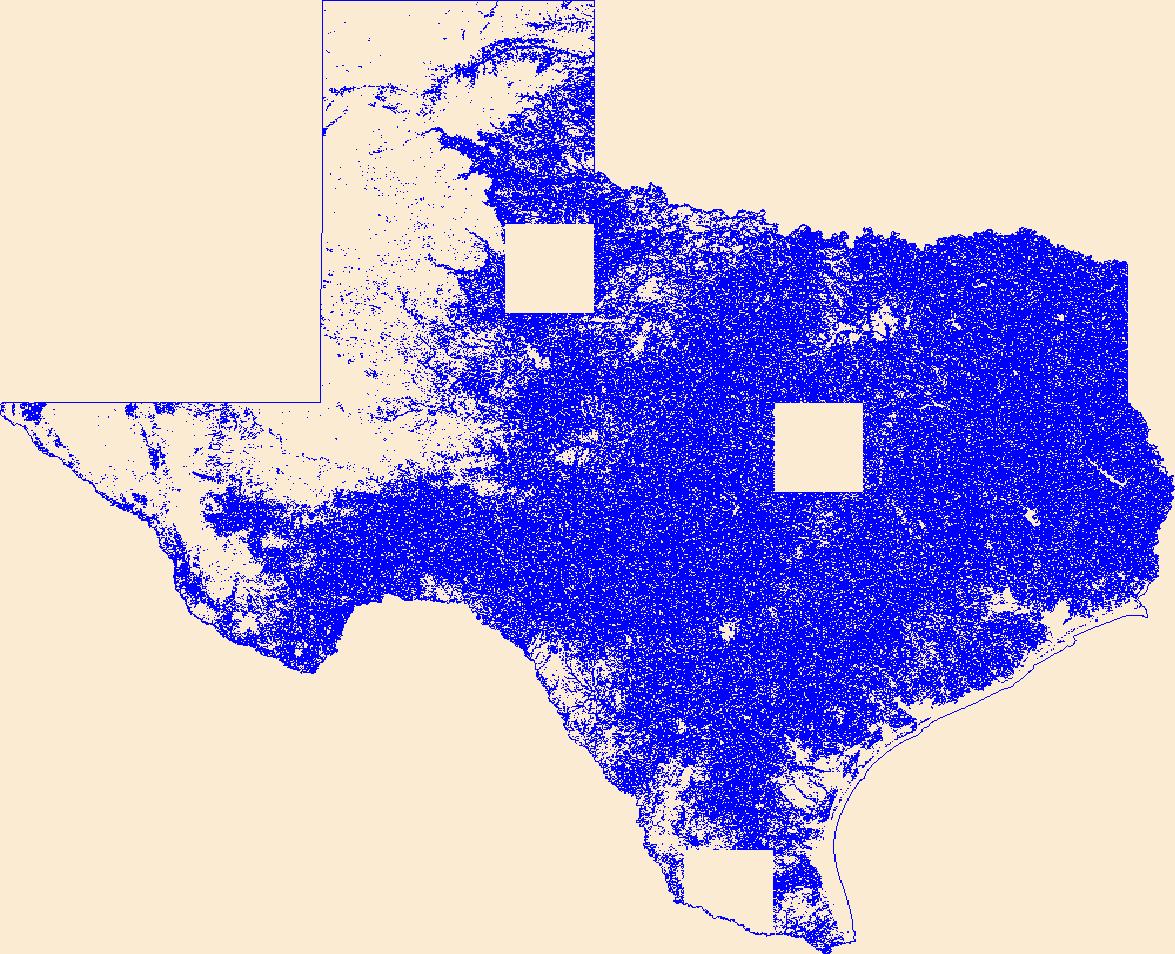
Geospatial data that is a derivative land cover product depicting woodland on topographic maps.
Hurricane Harvey made landfall near Rockport, Texas on August 25 as a category 4 hurricane with wind gusts exceeding 150 miles per hour. As Harvey moved inland the forward motion of the storm slowed down and produced tremendous rainfall amounts to southeastern Texas and southwestern Louisiana. Historic flooding occurred in Texas and Louisiana as a result of the widespread, heavy rainfall over an 8-day period in Louisiana in August and September 2017. Following the storm event, U.S. Geological Survey (USGS) hydrographers recovered and documented 2,123 high-water marks in Texas, noting location and height of the water above land surface. Many of these high-water marks were used to create flood-inundation maps for...
Types: Map Service,
OGC WFS Layer,
OGC WMS Layer,
OGC WMS Service;
Tags: Austin County,
Bellville,
Bessies Creek,
Booth,
Brazoria County,
In situ recovery (ISR) uranium mining is a technique in which uranium is extracted by a series of injection and recovery wells developed in a permeable sandstone host rock. Chemical constituents (lixiviants) are added to groundwater injection wells to mobilize uranium into groundwater. Before mining, baseline water quality is measured by sampling groundwater from the aquifer intended to be mined and over and underlying units over a geographic area that reflects the proposed mine location. After mining, groundwater is restored using a variety of techniques intended to return groundwater quality to as close to baseline as practicable. After groundwater has been restored, groundwater quality is monitored to determine...
Categories: Data;
Tags: Energy Resources,
South Texas,
Texas,
USGS Science Data Catalog (SDC),
Uranium,
These data represent simulated soil temperature and moisture conditions for current climate, and for future climate represented by all available climate models at two time periods during the 21st century. These data were used to: 1) quantify the direction and magnitude of expected changes in several measures of soil temperature and soil moisture, including the key variables used to distinguish the regimes used in the R and R categories; 2) assess how these changes will impact the geographic distribution of soil temperature and moisture regimes; and 3) explore the implications for using R and R categories for estimating future ecosystem resilience and resistance.

This map layer shows Indian lands of the United States. For the most part, only areas of 320 acres or more are included; some smaller areas deemed to be important or significant are also included. Federally-administered lands within a reservation are included for continuity; these may or may not be considered part of the reservation and are simply described with their feature type and the administrating Federal agency. Some established Indian lands which are larger than 320 acres are not included in this map layer because their boundaries were not available from the owning or administering agency.
These data identify the time (0-1 min, 1-2 min,or 2-3 min) and distance (≤50 meters, >50 meters) category when birds were first detected during 3-minutes point counts at stop locations associated with North American Breeding Bird Survey routes or route equivalents that were surveyed on dates between 2009 and 2016 and provide point location coordinates of stop locations along North American Breeding Bird Survey routes or route equivalents within (or within 60 miles) the Gulf Coastal Plains & Ozarks Landscape Conservation Cooperative boundary.
In cooperation with Dallas Water Utilities (DWU), the U.S. Geological Survey (USGS) measures nutrient and major-ion concentrations in selected reservoirs in north Texas. This data release documents water-quality data obtained from Ray Hubbard Lake, Grapevine Lake, Ray Roberts Lake, and Lake Lewisville during water years 2016-20. In addition to nutrient and major-ion concentrations, water-quality field properties and other selected constituents measured in the water-quality samples collected from these reservoirs are documented. The study began in water year 2016 (WY16) with monthly sampling of Ray Hubbard Lake. A water year is defined as the 12-month period from October 1 through September 30 and is designated...
Categories: Data Release - Revised;
Tags: Dallas,
Dallas,
Grapevine,
Grapevine Lake,
Lake Lewisville,
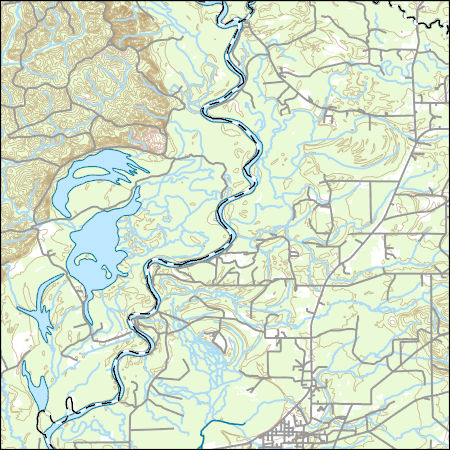
Layered GeoPDF 7.5 Minute Quadrangle Map. Layers of geospatial data include orthoimagery, roads, grids, geographic names, elevation contours, hydrography, and other selected map features.
Layered geospatial PDF Map. Layers of geospatial data include orthoimagery, roads, grids, geographic names, elevation contours, hydrography, and other selected map features.
|

|
