Filters: Tags: Carbon (X)
1,304 results (81ms)|
Filters
Date Range
Extensions Types Contacts
Categories
Tag Types
|
We examined bird and bat mortality at a new 89-turbine windfarm constructed in an environmentally sensitive area in north-central Iowa. The windfarm became operational in November 2001. It is located in cropland between three Wildlife Management Areas (WMA's) with historically high bird use. In the past, migrant and resident waterfowl, shorebirds, raptors, and songbirds moved between the WMA's through the area now occupied by the windfarm. Studies of bird collision mortality in California and elsewhere raised concerns about the possibility of mortalities in this area. From April 15, 2003 and December 15, 2003 we searched for dead animals under 26 randomly selected turbines. Six 76.2 m by 3.0 m transects were maintained...
This article offers a critical review of eight tradable permit markets: water permits at Fox River, Wisconsin; the U.S. leaded gasoline phase-out; sulfur dioxide credits under the U.S. Clean Air Act Amendments of 1990; the Regional Clean Air Incentives Market (RECLAIM) for controlling ozone and acid rain in Southern California; renewable energy credit trading at the regional level in the United States; individual transferrable quotas for fisheries at the national level in New Zealand; carbon credits traded under the European Union-Emissions Trading Scheme; and carbon offsets permitted under the Clean Development Mechanism of the Kyoto Protocol. By "critical" the article does not fully weigh the costs and benefits...
This dataset provides timeseries data on water quality and quantity, as collected or computed from outside sources. The format is many tables with one row per time series observation (1 tab-delimited file per site-variable combination, 1 zip file per site). This compilation of data is intended for use in estimating or interpreting metabolism. Sites were included if they met the initial criteria of having at least 100 dissolved oxygen observations and one of the accepted NWIS site types ('ST','ST-CA','ST-DCH','ST-TS', or 'SP'). This dataset is part of a larger data release of metabolism model inputs and outputs for 356 streams and rivers across the United States (https://doi.org/10.5066/F70864KX). The complete release...
Implementation of the U.S. Department of Agriculture (USDA) Conservation Reserve Program (CRP) and Wetlands Reserve Program (WRP) has resulted in the restoration of >2 million ha of wetland and grassland habitats in the Prairie Pothole Region (PPR). Restoration of habitats through these programs provides diverse ecosystem services to society, but few investigators have evaluated the environmental benefits achieved by these programs. We describe changes in wetland processes, functions, and ecosystem services that occur when wetlands and adjacent uplands on agricultural lands are restored through Farm Bill conservation programs. At the scale of wetland catchments, projects have had positive impacts on water storage,...
Categories: Publication;
Types: Citation;
Tags: carbon,
conservation,
ecosystem services,
grasslands,
prairie potholes,
Sagebrush ecosystems in North America have experienced extensive degradation since European settlement, and continue to further degrade from exotic invasive plants, greater fire frequency, intensive grazing practices, increased oil and gas development, climate change, and other factors. Remote sensing is often identified as a key information source to facilitate broad-area ecosystem-wide characterization, monitoring and analysis, however, approaches that characterize sagebrush with sufficient and accurate local detail across large areas to support ecosystem research and analysis are unavailable. We have developed a new remote sensing sagebrush ecosystem characterization approach for the state of Wyoming, U.S.A....
Our objective is to improve the scientific understanding of the modes, rates, and mechanisms of carbon stabilization and losses in soils from Alaska, California, and other Western states. We focus on the biophysical and microbial mechanisms that drive carbon gains and losses, and to use our data to improve models of soil carbon cycling. This catalog supports research from several projects focused on soil carbon cycling. It encompasses multiple types of datasets including environmental, ecological, biological, isotopic, mineralogical, genomic, flux, and modeled data from water, vegetation, soil, and atmospheric matrices. The catalog will be available online and to the public. Therefore, publication of data through...
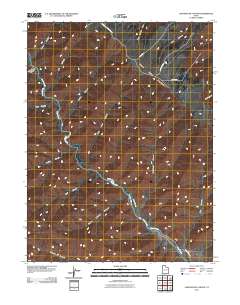
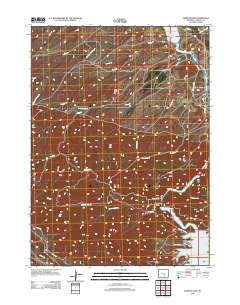
Layered GeoPDF 7.5 Minute Quadrangle Map. Layers of geospatial data include orthoimagery, roads, grids, geographic names, elevation contours, hydrography, and other selected map features.
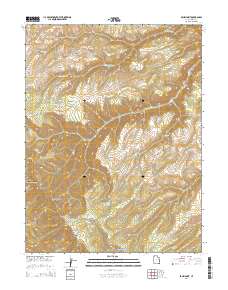
Layered GeoPDF 7.5 Minute Quadrangle Map. Layers of geospatial data include orthoimagery, roads, grids, geographic names, elevation contours, hydrography, and other selected map features.
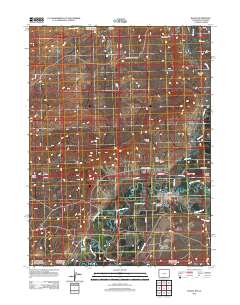
Layered GeoPDF 7.5 Minute Quadrangle Map. Layers of geospatial data include orthoimagery, roads, grids, geographic names, elevation contours, hydrography, and other selected map features.
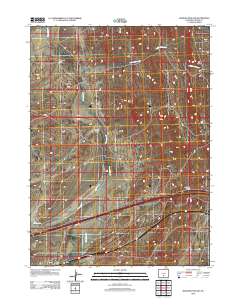
Layered GeoPDF 7.5 Minute Quadrangle Map. Layers of geospatial data include orthoimagery, roads, grids, geographic names, elevation contours, hydrography, and other selected map features.
Layered GeoPDF 7.5 Minute Quadrangle Map. Layers of geospatial data include orthoimagery, roads, grids, geographic names, elevation contours, hydrography, and other selected map features.
Layered GeoPDF 7.5 Minute Quadrangle Map. Layers of geospatial data include orthoimagery, roads, grids, geographic names, elevation contours, hydrography, and other selected map features.
Layered GeoPDF 7.5 Minute Quadrangle Map. Layers of geospatial data include orthoimagery, roads, grids, geographic names, elevation contours, hydrography, and other selected map features.
Layered GeoPDF 7.5 Minute Quadrangle Map. Layers of geospatial data include orthoimagery, roads, grids, geographic names, elevation contours, hydrography, and other selected map features.
Layered GeoPDF 7.5 Minute Quadrangle Map. Layers of geospatial data include orthoimagery, roads, grids, geographic names, elevation contours, hydrography, and other selected map features.
Layered GeoPDF 7.5 Minute Quadrangle Map. Layers of geospatial data include orthoimagery, roads, grids, geographic names, elevation contours, hydrography, and other selected map features.
Layered GeoPDF 7.5 Minute Quadrangle Map. Layers of geospatial data include orthoimagery, roads, grids, geographic names, elevation contours, hydrography, and other selected map features.
Layered GeoPDF 7.5 Minute Quadrangle Map. Layers of geospatial data include orthoimagery, roads, grids, geographic names, elevation contours, hydrography, and other selected map features.

Layered GeoPDF 7.5 Minute Quadrangle Map. Layers of geospatial data include orthoimagery, roads, grids, geographic names, elevation contours, hydrography, and other selected map features.
Layered GeoPDF 7.5 Minute Quadrangle Map. Layers of geospatial data include orthoimagery, roads, grids, geographic names, elevation contours, hydrography, and other selected map features.
|

|
