Filters: Tags: Colombia (X)
41 results (25ms)|
Filters
Date Range
Extensions Types Contacts
Categories Tag Types
|
This composite shaded relief image dataset depicts generalized bathymetry and topography of the Caribbean region.
The Caribbean region is part of World Energy Assessment region 6 (Central and South America). A fundamental task in the assessment is to map the locations and type of production for existing oil and gas fields. The Petroconsultants database is the only available database that has coverage for the Caribbean region. Oil and gas field symbols represent field center-points and are published with permission from Petroconsultants International Data Corporation, 2002 database.
Categories: Data,
pre-SM502.8;
Types: Downloadable,
Map Service,
OGC WFS Layer,
OGC WMS Layer,
Shapefile;
Tags: AG,
AI,
AN,
AW,
Anguilla,
Darien Expedition. Album Caption: Building with barred windows, probably at Cartagena, Colombia. 1870. NARA# 77-H-8913P-29.
Categories: Image;
Tags: Colombia,
Darien Expedition,
Expeditions,
Moran, John Collection,
O'Sullivan, Timothy H. Collection,
The Andes Mountains of South America host significant porphyry copper deposits. The region is the major global source of copper and an area of active mining, exploration, and development. The Andes region was included in USGS global compilations of porphyry deposits published by Singer and others in 2005 and 2008. Since that time, many new discoveries and new resource data have become available. This compilation includes new and updated location, references, and grade and tonnage data for porphyry copper deposits in the Andes along with grade and tonnage data from the previous compilations. The data release includes a data table, references, and shapefiles of porphyry copper locations and political boundaries.
A seismic hazard model for South America, based on a smoothed (gridded) seismicity model, a subduction model, a crustal fault model, and a ground motion model, has been produced by the U.S. Geological Survey. These models are combined to account for ground shaking from earthquakes on known faults as well as earthquakes on un-modeled faults. This data set represents the results of calculations of hazard curves for a grid of points with a spacing of 0.1 degrees in latitude and longitude. This particular data set is for peak ground acceleration with a 10 percent probability of exceedance in 50 years.
Categories: Data;
Types: Citation,
Downloadable,
Map Service,
OGC WFS Layer,
OGC WMS Layer,
Shapefile;
Tags: Argentina,
Bolivia,
Brazil,
Chile,
Colombia,
A seismic hazard model for South America, based on a smoothed (gridded) seismicity model, a subduction model, a crustal fault model, and a ground motion model, has been produced by the U.S. Geological Survey. These models are combined to account for ground shaking from earthquakes on known faults as well as earthquakes on un-modeled faults. This data set represents the results of calculations of hazard curves for a grid of points with a spacing of 0.1 degrees in latitude and longitude. This particular data set is for horizontal spectral response acceleration for 0.2-second period with a 50 percent probability of exceedance in 50 years.
Categories: Data;
Types: Citation,
Downloadable,
Map Service,
OGC WFS Layer,
OGC WMS Layer,
Shapefile;
Tags: Argentina,
Bolivia,
Brazil,
Chile,
Colombia,
A seismic hazard model for South America, based on a smoothed (gridded) seismicity model, a subduction model, a crustal fault model, and a ground motion model, has been produced by the U.S. Geological Survey. These models are combined to account for ground shaking from earthquakes on known faults as well as earthquakes on un-modeled faults. This data set represents the results of calculations of hazard curves for a grid of points with a spacing of 0.1 degrees in latitude and longitude. This particular data set is for horizontal spectral response acceleration for 1.0-second period with a 10 percent probability of exceedance in 50 years.
Categories: Data;
Types: Citation,
Downloadable,
Map Service,
OGC WFS Layer,
OGC WMS Layer,
Shapefile;
Tags: Argentina,
Bolivia,
Brazil,
Chile,
Colombia,
Darien Expedition. Album Caption: Cathedral at Cartagena, Colombia. 1870. NARA # 77-H-8913P-25.
Categories: Image;
Tags: Colombia,
Darien Expedition,
Expeditions,
Moran, John Collection,
O'Sullivan, Timothy H. Collection,
A comparison of the 2017 USGS South America seismic hazard model and the 2010 USGS preliminary model was made to see how the models differ. The comparison was made as the ratio of PGA at 10% probability of exceedance in 50 years. The ratio map is included here as a geo-referenced tiff (GeoTIFF). The gridded data for the 2017 PGA at 10% probability can be found here, while the gridded data for the 2010 PGA at 10% probability can be found in the zip archive that can be downloaded using a link on this page.
Categories: Data;
Types: Citation,
Downloadable,
GeoTIFF,
Map Service,
OGC WFS Layer,
OGC WMS Layer,
Raster,
Shapefile;
Tags: Argentina,
Bolivia,
Brazil,
Chile,
Colombia,
Maximum considered earthquake geometric mean peak ground acceleration maps (MCEG) are for assessment of the potential for liquefaction and soil strength loss, as well as for determination of lateral earth pressures in the design of basement and retaining walls. The maps are derived from the USGS seismic hazard maps in accordance with the site-specific ground-motion procedures of the NEHRP Recommended Seismic Provisions for New Building and Other Structures and the ASCE Minimum Design Loads for Buildings and Other Structures (also known as the ASCE 7 Standard; ASCE, 2016). The MCEG ground motions are taken as the lesser of probabilistic and deterministic values, as explained in the Provisions. The gridded probabilistic...
Categories: Data;
Types: Citation,
Downloadable,
Map Service,
OGC WFS Layer,
OGC WMS Layer,
Shapefile;
Tags: Argentina,
Bolivia,
Brazil,
Chile,
Colombia,
A comparison of the 2017 USGS South America seismic hazard model and the Global Seismic Hazard Assessment Program (GSHAP) model was made to see how the models differ. The comparison was made as the ratio of PGA at 10% probability of exceedance in 50 years. The ratio map is included here as a geo-referenced tiff (GeoTIFF). The gridded data for the 2017 PGA at 10% probability can be found here, while the GSHAP data can be found here. Shedlock, K.M., Giardini, Domenico, Grünthal, Gottfried, and Zhang, Peizhan, 2000, The GSHAP Global Seismic Hazar Map, Sesimological Research Letters, 71, 679-686. https://doi.org/10.1785/gssrl.71.6.679
Categories: Data;
Types: Citation,
Downloadable,
GeoTIFF,
Map Service,
OGC WFS Layer,
OGC WMS Layer,
Raster,
Shapefile;
Tags: Argentina,
Bolivia,
Brazil,
Chile,
Colombia,
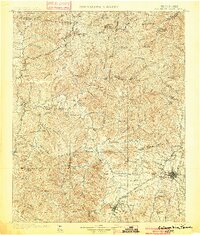
USGS Historical Quadrangle in GeoPDF.
This dataset includes a modified subset of polygon features that describe U.S. Geological Survey's defined geologic provinces of the World. Each province has a set of geologic characteristics that distinguish it from surrounding provinces. These characteristics may include dominant lithologies, the age of the strata, and/or structural type. Each province is assigned a unique numeric code and may fall within two or more countries or assessment regions.
Categories: Data,
pre-SM502.8;
Types: Downloadable,
Map Service,
OGC WFS Layer,
OGC WMS Layer,
Shapefile;
Tags: AG,
AI,
AN,
AW,
Anguilla,
A seismic hazard model for South America, based on a smoothed (gridded) seismicity model, a subduction model, a crustal fault model, and a ground motion model, has been produced by the U.S. Geological Survey. These models are combined to account for ground shaking from earthquakes on known faults as well as earthquakes on un-modeled faults. This data set represents the results of calculations of hazard curves for a grid of points with a spacing of 0.1 degrees in latitude and longitude. This particular data set is for Modified Mercalli Intensity with a 50 percent probability of exceedance in 50 years. The maps and data were derived from PGA ground-motion conversions of Worden et al. (2012), and include soil amplification...
Categories: Data;
Types: Citation,
Downloadable,
GeoTIFF,
Map Service,
OGC WFS Layer,
OGC WMS Layer,
Raster,
Shapefile;
Tags: Argentina,
Bolivia,
Brazil,
Chile,
Colombia,
A seismic hazard model for South America, based on a smoothed (gridded) seismicity model, a subduction model, a crustal fault model, and a ground motion model, has been produced by the U.S. Geological Survey. These models are combined to account for ground shaking from earthquakes on known faults as well as earthquakes on un-modeled faults. This data set represents the results of calculations of hazard curves for a grid of points with a spacing of 0.1 degrees in latitude and longitude. This particular data set is for horizontal spectral response acceleration for 0.2-second period with a 2 percent probability of exceedance in 50 years.
Categories: Data;
Types: Citation,
Downloadable,
Map Service,
OGC WFS Layer,
OGC WMS Layer,
Shapefile;
Tags: Argentina,
Bolivia,
Brazil,
Chile,
Colombia,
A seismic hazard model for South America, based on a smoothed (gridded) seismicity model, a subduction model, a crustal fault model, and a ground motion model, has been produced by the U.S. Geological Survey. These models are combined to account for ground shaking from earthquakes on known faults as well as earthquakes on un-modeled faults. This data set represents the hazard curves for a grid of points with a spacing of 0.1 degrees in latitude and longitude. It represents the annual rate of exceedance versus 0.2-second spectral response acceleration.
A seismic hazard model for South America, based on a smoothed (gridded) seismicity model, a subduction model, a crustal fault model, and a ground motion model, has been produced by the U.S. Geological Survey. These models are combined to account for ground shaking from earthquakes on known faults as well as earthquakes on un-modeled faults. This data set represents the results of calculations of hazard curves for a grid of points with a spacing of 0.1 degrees in latitude and longitude. This particular data set is for peak ground acceleration with a 2 percent probability of exceedance in 50 years.
Categories: Data;
Types: Citation,
Downloadable,
Map Service,
OGC WFS Layer,
OGC WMS Layer,
Shapefile;
Tags: Argentina,
Bolivia,
Brazil,
Chile,
Colombia,
Darien Expedition. Album Caption: Spanish fortress of San Lorenzo, Cartagena. 1870
Categories: Image;
Tags: Colombia,
Darien Expedition,
Expeditions,
Moran, John Collection,
O'Sullivan, Timothy H. Collection,
Risk-targeted maximum considered earthquake ground acceleration maps (MCER) are for the design of buildings and other structures. The maps are derived from the USGS seismic hazard maps in accordance with the site-specific ground-motion procedures of the NEHRP Recommended Seismic Provisions for New Building and Other Structures and the ASCE Minimum Design Loads for Buildings and Other Structures (also known as the ASCE 7 Standard; ASCE, 2016). The MCER ground motions are taken as the lesser of probabilistic and deterministic values, as explained in the Provisions. The gridded probabilistic and deterministic values for 0.2-second spectral response acceleration are available here.
Categories: Data;
Types: Citation,
Downloadable,
Map Service,
OGC WFS Layer,
OGC WMS Layer,
Shapefile;
Tags: Argentina,
Bolivia,
Brazil,
Chile,
Colombia,
A seismic hazard model for South America, based on a smoothed (gridded) seismicity model, a subduction model, a crustal fault model, and a ground motion model, has been produced by the U.S. Geological Survey. These models are combined to account for ground shaking from earthquakes on known faults as well as earthquakes on un-modeled faults. This data set represents the results of calculations of hazard curves for a grid of points with a spacing of 0.1 degrees in latitude and longitude. This particular data set is for horizontal spectral response acceleration for 1.0-second period with a 50 percent probability of exceedance in 50 years.
Categories: Data;
Types: Citation,
Downloadable,
Map Service,
OGC WFS Layer,
OGC WMS Layer,
Shapefile;
Tags: Argentina,
Bolivia,
Brazil,
Chile,
Colombia,
|

|
