Filters: Tags: Colorado (X)
16,336 results (846ms)|
Filters
Date Range
Extensions Types Contacts
Categories Tag Types
|
These data were collected as part of a field trial to test the effectiveness of a sylvatic plague vaccine (see Rocke et al., 2017 for details). Vaccine and control plots were selected randomly from the available pairs at each location. Baits containing Rhodamine B, a biomarker, were distributed at each plot. At least 1 week and no more than 2 months post-baiting each year, local collaborators captured, marked, and sampled prairie dogs. Hair and whisker samples were collected from up to 50 unique prairie dogs from each plot each year. Sex, age, weight, and the identity of all current-year and prior-year recaptures were recorded for each captured animal. In the laboratory, hair/whiskers were assessed for the presence...
Categories: Data;
Types: Map Service,
OGC WFS Layer,
OGC WMS Layer,
OGC WMS Service;
Tags: Arizona,
Awapa Plateau,
Buffalo Gap National Grasslands,
Cedar City,
Charles M. Russell National Wildlife Refuge,
This shapefile is the official boundary of the Western Native Trout Initiative. The boundary was originally developed by the United States Fish and Wildlife Service and was updated in 2013 to reflect revisions from the Western Native Trout Initiative, a recognized Fish Habitat Partnership (FHP) of the National Fish Habitat Partnership.
Categories: Data;
Types: ArcGIS REST Map Service,
ArcGIS Service Definition,
Downloadable,
Map Service;
Tags: Alaska,
Analytical boundary,
Aquatic habitats,
Arizona,
Boundaries,
The “Biophysical assessment for indemnity selection of federal lands in Colorado: Indemnity Unit locations” dataset delineates the spatial locations of 89 Indemnity Units, comprising 339 parcels of federal lands. These lands, currently managed by the Bureau of Land Management (BLM), are under consideration for transfer of ownership to the State of Colorado in compensation for federal lands not available for transfer at the time of statehood. The Indemnity Units total 23,130 acres of surface and mineral estate and 6,150 acres of mineral estate only. The specific land parcels to be transferred to the State will be finalized after an environmental analysis is completed, as required by the National Environmental Policy...
Categories: Data;
Types: Downloadable,
Map Service,
OGC WFS Layer,
OGC WMS Layer,
Shapefile;
Tags: Colorado,
boundaries,
cadastral areas
Climate Distance Mapper is an interactive web mapping application designed to facilitate informed seed sourcing decisions and to aid in directing regional seed collections. Implemented as a shiny web application (Chang et al. 2017), Climate Distance Mapper is hosted on the web at: https://usgs-werc-shinytools.shinyapps.io/Climate_Distance_Mapper/. The application is designed to guide restoration seed sourcing in the desert southwest by allowing users to interactively match seed sources with restoration sites climatic differences – in the form of multivariate climate distance values – between restoration sites and the surrounding landscape. Climatic distances are based on a combination of variables likely to influence...
Five principal components are used to represent the climate variation in an original set of 12 composite climate variables reflecting complex precipitation and temperature gradients. The dataset provides coverage for future climate (defined as the 2040-2070 normal period) under the RCP8.5 emission scenarios. Climate variables were chosen based on their known influence on local adaptation in plants, and include: mean annual temperature, summer maximum temperature, winter minimum temperature, annual temperature range, temperature seasonality (coefficient of variation in monthly average temperatures), mean annual precipitation, winter precipitation, summer precipitation, proportion of summer precipitation, precipitation...
Categories: Data;
Types: Downloadable,
GeoTIFF,
Map Service,
Raster;
Tags: Arizona,
California,
Colorado,
Colorado Plateau,
Great Basin,
These data represent simulated soil temperature and moisture conditions for current climate, and for future climate represented by all available climate models at two time periods during the 21st century. These data were used to: 1) quantify the direction and magnitude of expected changes in several measures of soil temperature and soil moisture, including the key variables used to distinguish the regimes used in the R and R categories; 2) assess how these changes will impact the geographic distribution of soil temperature and moisture regimes; and 3) explore the implications for using R and R categories for estimating future ecosystem resilience and resistance.
The U.S. Geological Survey (USGS), in cooperation with the U.S. Air Force Academy, carried out bathymetry surveys to better characterize the 2019 water-supply capacity of Deadmans Lake; Golf Course Reservoir 9; Ice Lake; Kettle Lakes 1, 2, and 3; and Non-Potable reservoirs 1, 2, 3, and 4 at the U.S. Air Force Academy, Colorado. Survey points from bathymetry and terrestrial datasets were collected using real-time kinematic (RTK) Global Navigation Satellite Systems (GNSS) at each of the aforementioned lakes or reservoirs and merged in geographic information system software, ArcMap, to produce continuous topographic datasets with common horizontal and vertical datums (North American Datum [NAD] 83 and North American...
Digital terrain model (DTM) and associated metadata for basin B1.
Categories: Data;
Types: Downloadable,
GeoTIFF,
Map Service,
Raster;
Tags: Colorado,
Rio Blanco,
UAS,
Unmanned Aerial Systems,
biota,
Final surface model (SRF) and associated metadata for basin B1.
Categories: Data;
Types: Downloadable,
GeoTIFF,
Map Service,
Raster;
Tags: Colorado,
Rio Blanco,
UAS,
Unmanned Aerial Systems,
biota,

This map layer shows Indian lands of the United States. For the most part, only areas of 320 acres or more are included; some smaller areas deemed to be important or significant are also included. Federally-administered lands within a reservation are included for continuity; these may or may not be considered part of the reservation and are simply described with their feature type and the administrating Federal agency. Some established Indian lands which are larger than 320 acres are not included in this map layer because their boundaries were not available from the owning or administering agency.
Map containing historical census data from 1900 - 2000 throughout the western United States at the county level. Data includes total population, population density, and percent population change by decade for each county. Population data was obtained from the US Census Bureau and joined to 1:2,000,000 scale National Atlas counties shapefile.
Categories: Data;
Types: Downloadable,
Map Service,
OGC WFS Layer,
OGC WMS Layer,
Shapefile;
Tags: Arizona,
California,
Colorado,
Idaho,
Montana,
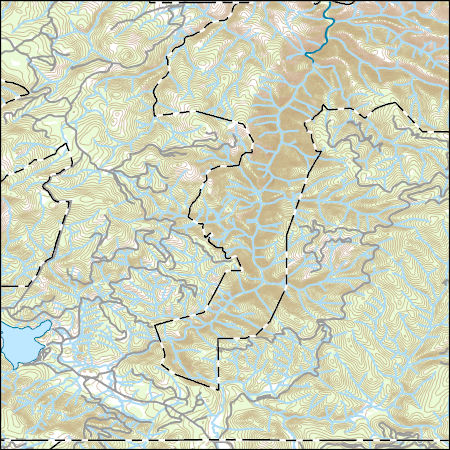
Layers of geospatial data include contours, boundaries, land cover, hydrography, roads, transportation, geographic names, structures, and other selected map features.
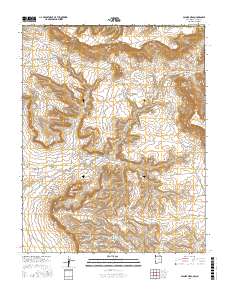
Layered geospatial PDF Map. Layers of geospatial data include orthoimagery, roads, grids, geographic names, elevation contours, hydrography, and other selected map features.
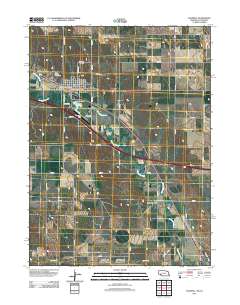
Layered GeoPDF 7.5 Minute Quadrangle Map. Layers of geospatial data include orthoimagery, roads, grids, geographic names, elevation contours, hydrography, and other selected map features.
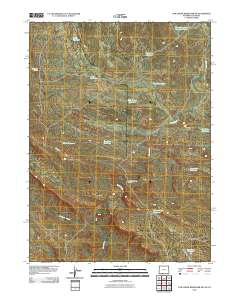
Layered GeoPDF 7.5 Minute Quadrangle Map. Layers of geospatial data include orthoimagery, roads, grids, geographic names, elevation contours, hydrography, and other selected map features.
Layered GeoPDF 7.5 Minute Quadrangle Map. Layers of geospatial data include orthoimagery, roads, grids, geographic names, elevation contours, hydrography, and other selected map features.
Layered GeoPDF 7.5 Minute Quadrangle Map. Layers of geospatial data include orthoimagery, roads, grids, geographic names, elevation contours, hydrography, and other selected map features.
Layered GeoPDF 7.5 Minute Quadrangle Map. Layers of geospatial data include orthoimagery, roads, grids, geographic names, elevation contours, hydrography, and other selected map features.
Layered geospatial PDF Map. Layers of geospatial data include orthoimagery, roads, grids, geographic names, elevation contours, hydrography, and other selected map features.
Layered GeoPDF 7.5 Minute Quadrangle Map. Layers of geospatial data include orthoimagery, roads, grids, geographic names, elevation contours, hydrography, and other selected map features.
|

|
