Filters: Tags: Cook County (X)
441 results (101ms)|
Filters
Date Range
Types Contacts
Categories Tag Types Tag Schemes |
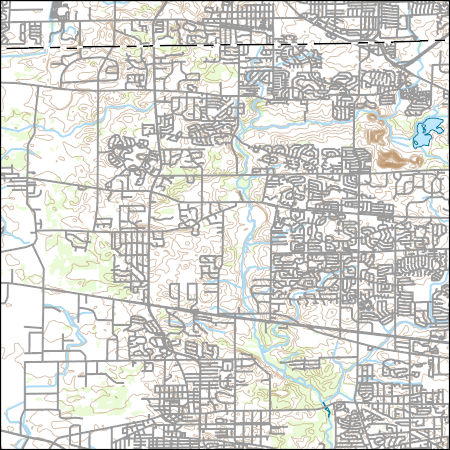
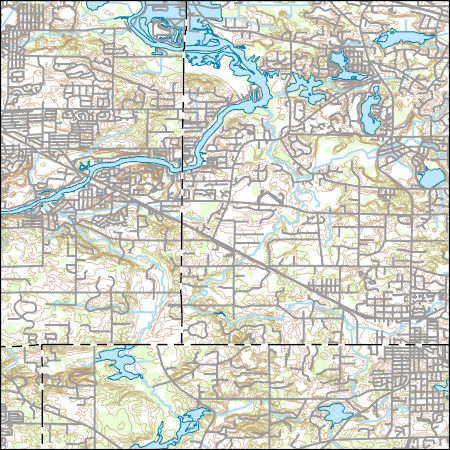
Layers of geospatial data include contours, boundaries, land cover, hydrography, roads, transportation, geographic names, structures, and other selected map features.
Types: Citation;
Tags: 7.5 x 7.5 minute,
7.5 x 7.5 minute,
Combined Vector,
Combined Vector,
Combined Vector,
USGS Topo Map Vector Data (Vector) 2488 Barrington, Illinois 20210628 for 7.5 x 7.5 minute Shapefile
Layers of geospatial data include contours, boundaries, land cover, hydrography, roads, transportation, geographic names, structures, and other selected map features.
Types: Citation;
Tags: 7.5 x 7.5 minute,
7.5 x 7.5 minute,
Combined Vector,
Combined Vector,
Combined Vector,
Layers of geospatial data include contours, boundaries, land cover, hydrography, roads, transportation, geographic names, structures, and other selected map features.
Types: Citation;
Tags: 7.5 x 7.5 minute,
7.5 x 7.5 minute,
Combined Vector,
Combined Vector,
Combined Vector,
Layers of geospatial data include contours, boundaries, land cover, hydrography, roads, transportation, geographic names, structures, and other selected map features.
Layers of geospatial data include contours, boundaries, land cover, hydrography, roads, transportation, geographic names, structures, and other selected map features.
Layers of geospatial data include contours, boundaries, land cover, hydrography, roads, transportation, geographic names, structures, and other selected map features.
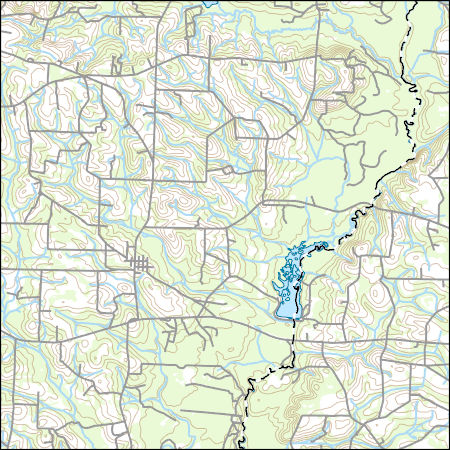
Layered geospatial PDF 7.5 Minute Quadrangle Map. Layers of geospatial data include orthoimagery, roads, grids, geographic names, elevation contours, hydrography, and other selected map features. This map is derived from GIS (geospatial information system) data. It represents a repackaging of GIS data in traditional map form, not creation of new information. The geospatial data in this map are from selected National Map data holdings and other government sources.
Layered geospatial PDF 7.5 Minute Quadrangle Map. Layers of geospatial data include orthoimagery, roads, grids, geographic names, elevation contours, hydrography, and other selected map features. This map is derived from GIS (geospatial information system) data. It represents a repackaging of GIS data in traditional map form, not creation of new information. The geospatial data in this map are from selected National Map data holdings and other government sources.

Layered geospatial PDF 7.5 Minute Quadrangle Map. Layers of geospatial data include orthoimagery, roads, grids, geographic names, elevation contours, hydrography, and other selected map features. This map is derived from GIS (geospatial information system) data. It represents a repackaging of GIS data in traditional map form, not creation of new information. The geospatial data in this map are from selected National Map data holdings and other government sources.
Layered geospatial PDF 7.5 Minute Quadrangle Map. Layers of geospatial data include orthoimagery, roads, grids, geographic names, elevation contours, hydrography, and other selected map features. This map is derived from GIS (geospatial information system) data. It represents a repackaging of GIS data in traditional map form, not creation of new information. The geospatial data in this map are from selected National Map data holdings and other government sources.
Layered geospatial PDF 7.5 Minute Quadrangle Map. Layers of geospatial data include orthoimagery, roads, grids, geographic names, elevation contours, hydrography, and other selected map features. This map is derived from GIS (geospatial information system) data. It represents a repackaging of GIS data in traditional map form, not creation of new information. The geospatial data in this map are from selected National Map data holdings and other government sources.
Layered geospatial PDF 7.5 Minute Quadrangle Map. Layers of geospatial data include orthoimagery, roads, grids, geographic names, elevation contours, hydrography, and other selected map features. This map is derived from GIS (geospatial information system) data. It represents a repackaging of GIS data in traditional map form, not creation of new information. The geospatial data in this map are from selected National Map data holdings and other government sources.
Layered geospatial PDF 7.5 Minute Quadrangle Map. Layers of geospatial data include orthoimagery, roads, grids, geographic names, elevation contours, hydrography, and other selected map features. This map is derived from GIS (geospatial information system) data. It represents a repackaging of GIS data in traditional map form, not creation of new information. The geospatial data in this map are from selected National Map data holdings and other government sources.
Layered geospatial PDF 7.5 Minute Quadrangle Map. Layers of geospatial data include orthoimagery, roads, grids, geographic names, elevation contours, hydrography, and other selected map features. This map is derived from GIS (geospatial information system) data. It represents a repackaging of GIS data in traditional map form, not creation of new information. The geospatial data in this map are from selected National Map data holdings and other government sources.
Layered geospatial PDF 7.5 Minute Quadrangle Map. Layers of geospatial data include orthoimagery, roads, grids, geographic names, elevation contours, hydrography, and other selected map features. This map is derived from GIS (geospatial information system) data. It represents a repackaging of GIS data in traditional map form, not creation of new information. The geospatial data in this map are from selected National Map data holdings and other government sources.
These data were collected using a 1200 kHz TRDI Rio Grande acoustic Doppler current profiler (ADCP) in mode 12 with 25 centimeter bins from a moving boat. The data were georeferenced with a Hemisphere Crescent A100 differential Global Positioning System (GPS) receiver with submeter accuracy. The data have been depth-averaged over the entire measured portion of the water column and temporally averaged over 5-second intervals to reduce noise. These data were collected by the U.S. Geological Survey (USGS) concurrently with environmental DNA (eDNA) sampling in this reach of the Chicago Sanitary and Ship Canal (CSSC) by the U.S. Fish and Wildlife Service (USFWS). Data were processed using the Velocity Mapping Toolbox...
Categories: Data;
Types: Citation,
Map Service,
OGC WFS Layer,
OGC WMS Layer,
OGC WMS Service;
Tags: Chicago Sanitary and Ship Canal,
Cook County,
DuPage County,
Illinois,
Velocity,
These data were collected using a 1200 kHz TRDI Rio Grande acoustic Doppler current profiler (ADCP) in mode 12 with 25 centimeter bins from a moving boat. The data were georeferenced with a Hemisphere Crescent A100 differential Global Positioning System (GPS) receiver with submeter accuracy. The data have been layer-averaged over the lower portion of the water column (0 to 4 meters above the bed). These data were collected by the U.S. Geological Survey (USGS) concurrently with environmental DNA (eDNA) sampling in this reach of the Chicago Sanitary and Ship Canal by the U.S. Fish and Wildlife Service (USFWS). Data were processed using the Velocity Mapping Toolbox (Parsons and others, 2013). NOTE: Any data assigned...
Categories: Data;
Types: Citation,
Map Service,
OGC WFS Layer,
OGC WMS Layer,
OGC WMS Service;
Tags: Chicago Sanitary and Ship Canal,
Cook County,
Illinois,
Velocity
Layered geospatial PDF 7.5 Minute Quadrangle Map. Layers of geospatial data include orthoimagery, roads, grids, geographic names, elevation contours, hydrography, and other selected map features. This map is derived from GIS (geospatial information system) data. It represents a repackaging of GIS data in traditional map form, not creation of new information. The geospatial data in this map are from selected National Map data holdings and other government sources.
Layered geospatial PDF 7.5 Minute Quadrangle Map. Layers of geospatial data include orthoimagery, roads, grids, geographic names, elevation contours, hydrography, and other selected map features. This map is derived from GIS (geospatial information system) data. It represents a repackaging of GIS data in traditional map form, not creation of new information. The geospatial data in this map are from selected National Map data holdings and other government sources.
Layered geospatial PDF 7.5 Minute Quadrangle Map. Layers of geospatial data include orthoimagery, roads, grids, geographic names, elevation contours, hydrography, and other selected map features. This map is derived from GIS (geospatial information system) data. It represents a repackaging of GIS data in traditional map form, not creation of new information. The geospatial data in this map are from selected National Map data holdings and other government sources.
|

|
