Filters: Tags: TX (X)
24,554 results (199ms)|
Filters
Date Range
Extensions Types
Contacts
Categories Tag Types
|
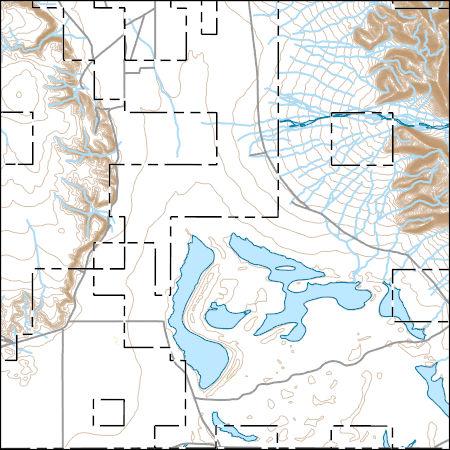
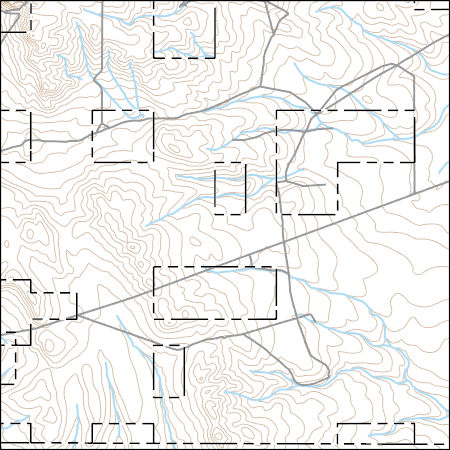
Layers of geospatial data include contours, boundaries, land cover, hydrography, roads, transportation, geographic names, structures, and other selected map features.
Types: Citation;
Tags: 7.5 x 7.5 minute,
7_5_Min,
Combined Vector,
Combined Vector,
Combined Vector,

The Geographic Names Information System (GNIS) is the Federal standard for geographic nomenclature. The U.S. Geological Survey developed the GNIS for the U.S. Board on Geographic Names, a Federal inter-agency body chartered by public law to maintain uniform feature name usage throughout the Government and to promulgate standard names to the public. The GNIS is the official repository of domestic geographic names data; the official vehicle for geographic names use by all departments of the Federal Government; and the source for applying geographic names to Federal electronic and printed products of all types.
Layers of geospatial data include contours, boundaries, land cover, hydrography, roads, transportation, geographic names, structures, and other selected map features.
Layers of geospatial data include contours, boundaries, land cover, hydrography, roads, transportation, geographic names, structures, and other selected map features.
Types: Citation;
Tags: 7.5 x 7.5 minute,
7_5_Min,
Combined Vector,
Combined Vector,
Combined Vector,
Layers of geospatial data include contours, boundaries, land cover, hydrography, roads, transportation, geographic names, structures, and other selected map features.

Layers of geospatial data include contours, boundaries, land cover, hydrography, roads, transportation, geographic names, structures, and other selected map features.
Types: Citation;
Tags: 7.5 x 7.5 minute,
7_5_Min,
Combined Vector,
Combined Vector,
Combined Vector,
Layers of geospatial data include contours, boundaries, land cover, hydrography, roads, transportation, geographic names, structures, and other selected map features.
Types: Citation;
Tags: 7.5 x 7.5 minute,
7_5_Min,
Combined Vector,
Combined Vector,
Combined Vector,
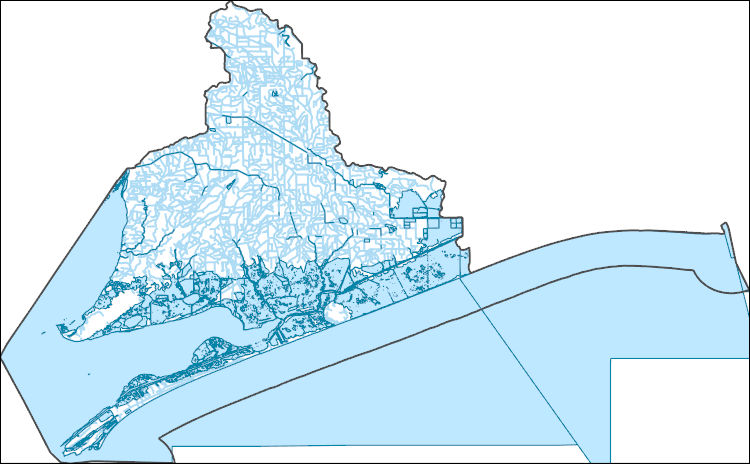
The National Hydrography Dataset (NHD) is a feature-based database that interconnects and uniquely identifies the stream segments or reaches that make up the nation's surface water drainage system. NHD data was originally developed at 1:100,000-scale and exists at that scale for the whole country. This high-resolution NHD, generally developed at 1:24,000/1:12,000 scale, adds detail to the original 1:100,000-scale NHD. (Data for Alaska, Puerto Rico and the Virgin Islands was developed at high-resolution, not 1:100,000 scale.) Local resolution NHD is being developed where partners and data exist. The NHD contains reach codes for networked features, flow direction, names, and centerline representations for areal water...
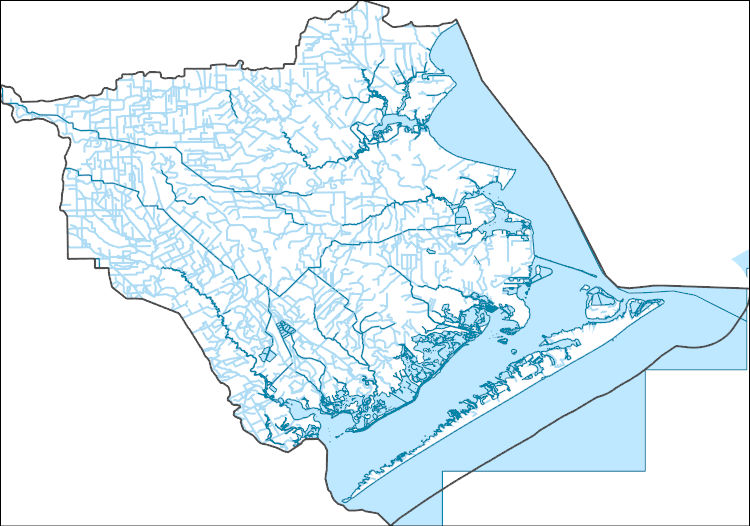
The National Hydrography Dataset (NHD) is a feature-based database that interconnects and uniquely identifies the stream segments or reaches that make up the nation's surface water drainage system. NHD data was originally developed at 1:100,000-scale and exists at that scale for the whole country. This high-resolution NHD, generally developed at 1:24,000/1:12,000 scale, adds detail to the original 1:100,000-scale NHD. (Data for Alaska, Puerto Rico and the Virgin Islands was developed at high-resolution, not 1:100,000 scale.) Local resolution NHD is being developed where partners and data exist. The NHD contains reach codes for networked features, flow direction, names, and centerline representations for areal water...
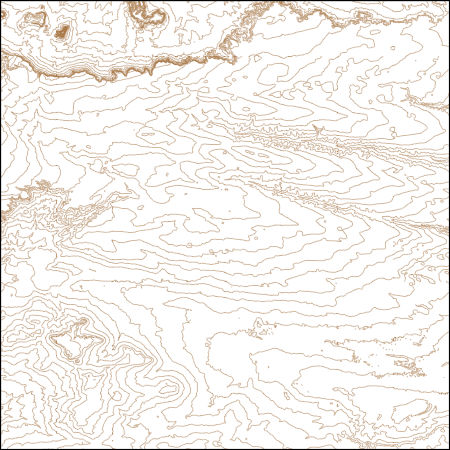
These vector contour lines are derived from the 3D Elevation Program using automated and semi-automated processes. They were created to support 1:24,000-scale CONUS and Hawaii, 1:25,000-scale Alaska, and 1:20,000-scale Puerto Rico / US Virgin Island topographic map products, but are also published in this GIS vector format. Contour intervals are assigned by 7.5-minute quadrangle, so this vector dataset is not visually seamless across quadrangle boundaries. The vector lines have elevation attributes (in feet above mean sea level on NAVD88), but this dataset does not carry line symbols or annotation.
These vector contour lines are derived from the 3D Elevation Program using automated and semi-automated processes. They were created to support 1:24,000-scale CONUS and Hawaii, 1:25,000-scale Alaska, and 1:20,000-scale Puerto Rico / US Virgin Island topographic map products, but are also published in this GIS vector format. Contour intervals are assigned by 7.5-minute quadrangle, so this vector dataset is not visually seamless across quadrangle boundaries. The vector lines have elevation attributes (in feet above mean sea level on NAVD88), but this dataset does not carry line symbols or annotation.
These vector contour lines are derived from the 3D Elevation Program using automated and semi-automated processes. They were created to support 1:24,000-scale CONUS and Hawaii, 1:25,000-scale Alaska, and 1:20,000-scale Puerto Rico / US Virgin Island topographic map products, but are also published in this GIS vector format. Contour intervals are assigned by 7.5-minute quadrangle, so this vector dataset is not visually seamless across quadrangle boundaries. The vector lines have elevation attributes (in feet above mean sea level on NAVD88), but this dataset does not carry line symbols or annotation.
The Assessment Unit is the fundamental unit used in the National Assessment Project for the assessment of undiscovered oil and gas resources. The Assessment Unit is defined within the context of the higher-level Total Petroleum System. The Assessment Unit is shown here as a geographic boundary interpreted, defined, and mapped by the geologists responsible for the province and incorporates a set of known or postulated oil and (or) gas accumulations sharing similar geologic, geographic, and temporal properties within the Total Petroleum System, such as source rock, timing, migration pathways, trapping mechanism, and hydrocarbon type. The Assessment Unit boundary is defined geologically as the limits of the geologic...
This dataset of anticlines is intended primarily for reference; it includes major structures such as those shown on Plate 2, Principal structural features, Gulf of Mexico Basin (compiled by T.E. Ewing and R.F. Lopez), in Volume J, The Geology of North America (1991). This dataset contains basic data and interpretations developed and compiled by the U.S. Geological Survey's Framework Studies and Assessment of the Gulf Coast Project. Other major sources of data include publicly available information from state agencies as well as publications of the U.S. Geological Survey and other scientific organizations. In cases where company proprietary data were used to produce various derivatives such as contour surfaces, the...
Categories: Data,
pre-SM502.8;
Types: Downloadable,
Map Service,
OGC WFS Layer,
OGC WMS Layer,
Shapefile;
Tags: AL,
AR,
Anticlines,
Coal,
Coalbed Methane,
The maximum extent of Cretaceous onlap is generalized from Plate 3, Structure at the base and subcrop below Mesozoic marine section, Gulf of Mexico Basin (compiled by A. Salvador) in Volume J, The Geology of North America (1991). This dataset contains basic data and interpretations developed and compiled by the U.S. Geological Survey's Framework Studies and Assessment of the Gulf Coast Project. Other major sources of data include publicly available information from state agencies as well as publications of the U.S. Geological Survey and other scientific organizations. In cases where company proprietary data were used to produce various derivatives such as contour surfaces, the source is cited but the data are not...
Categories: Data,
pre-SM502.8;
Types: Downloadable,
Map Service,
OGC WFS Layer,
OGC WMS Layer,
Shapefile;
Tags: 47 = Western Gulf,
48 = East Texas Basin,
49 = Louisiana-Mississippi Salt Basins,
50 = Florida Peninsula,
AL,
Cell maps for each oil and gas assessment unit were created by the USGS as a method for illustrating the degree of exploration, type of production, and distribution of production in an assessment unit or province. Each cell represents a quarter-mile square of the land surface, and the cells are coded to represent whether the wells included within the cell are predominantly oil-producing, gas-producing, both oil and gas-producing, dry, or the type of production of the wells located within the cell is unknown. The well information was initially retrieved from the IHS Energy Group, PI/Dwights PLUS Well Data on CD-ROM, which is a proprietary, commercial database containing information for most oil and gas wells in the...
Categories: Data,
pre-SM502.8;
Types: Downloadable,
Map Service,
OGC WFS Layer,
OGC WMS Layer,
Shapefile;
Tags: 504501 = Barnett Paleozoic,
50450101 = Paleozoic Shelf and Bank Carbonate Oil and Gas,
50450102 = Mississippian Chappel Pinnacle Reef Oil and Gas,
50450161 = Greater Newark East Frac-Barrier Continuous Barnett Shale Gas,
50450162 = Extended Continuous Barnett Shale Gas,
The Total Petroleum System is used in the National Assessment Project and incorporates the Assessment Unit, which is the fundamental geologic unit used for the assessment of undiscovered oil and gas resources. The Total Petroleum System is shown here as a geographic boundary defined and mapped by the geologist responsible for the province and incorporates not only the set of known or postulated oil and (or) gas accumulations, but also the geologic interpretation of the essential elements and processes within the petroleum system that relate to source, generation, migration, accumulation, and trapping of the discovered and undiscovered petroleum resource(s).
Layers of geospatial data include contours, boundaries, land cover, hydrography, roads, transportation, geographic names, structures, and other selected map features.
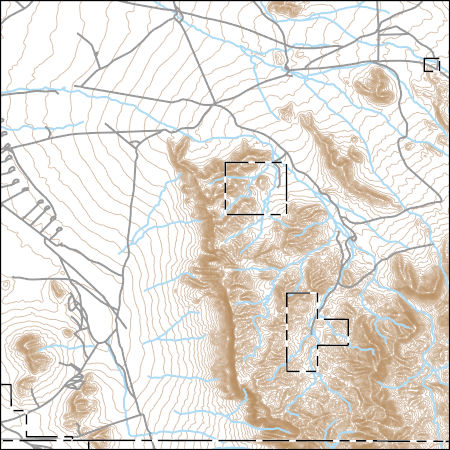
Layers of geospatial data include contours, boundaries, land cover, hydrography, roads, transportation, geographic names, structures, and other selected map features.
Types: Citation;
Tags: 7.5 x 7.5 minute,
7_5_Min,
Combined Vector,
Combined Vector,
Combined Vector,
Layers of geospatial data include contours, boundaries, land cover, hydrography, roads, transportation, geographic names, structures, and other selected map features.
|

|
