Filters: Tags: United States of America (X) > partyWithName: U.S. Geological Survey (X)
769 results (61ms)|
Filters
Date Range
Extensions Types Contacts
Categories Tag Types Tag Schemes |
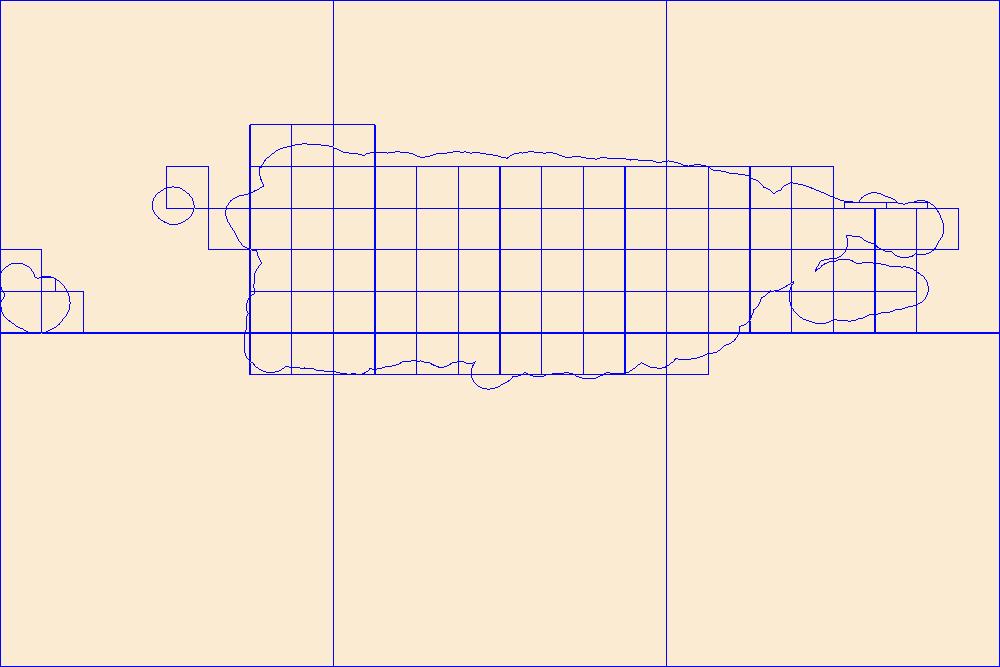
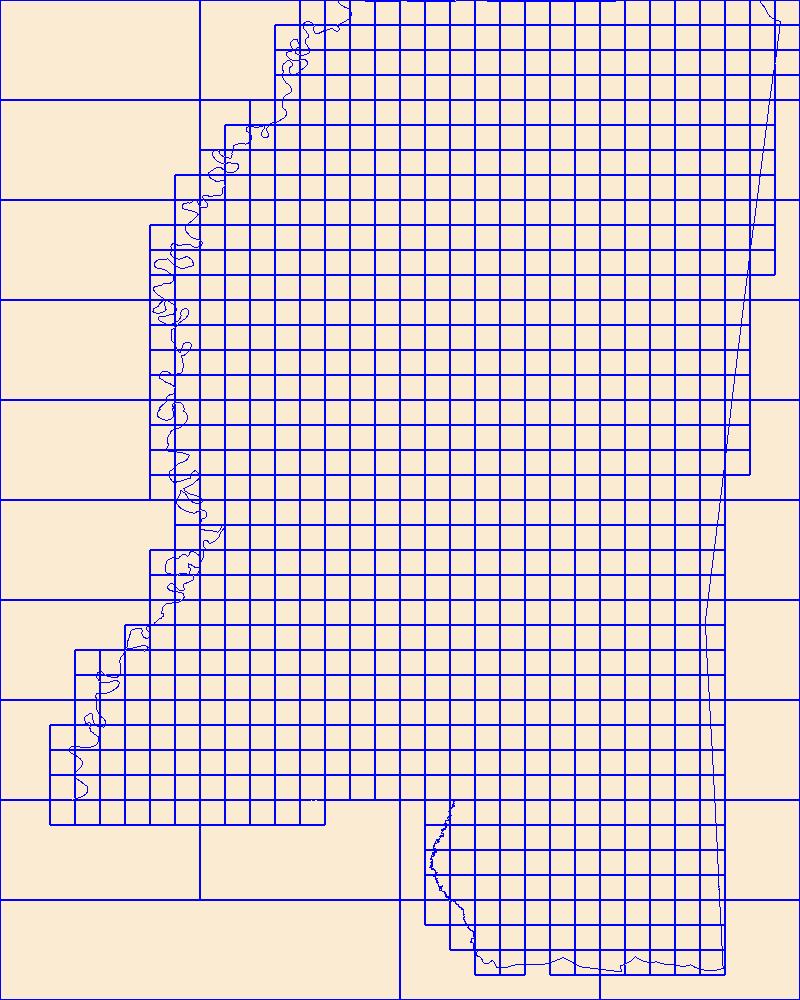
This data represents the map extent for current and historical USGS topographic maps for the United States and Territories, including 1 X 2 Degree, 1 X 1 Degree, 30 X 60 Minute, 15 X 15 Minute, 7.5 X 7.5 Minute, and 3.75 X 3.75 Minute. The grid was generated using ESRI ArcInfo GIS software.
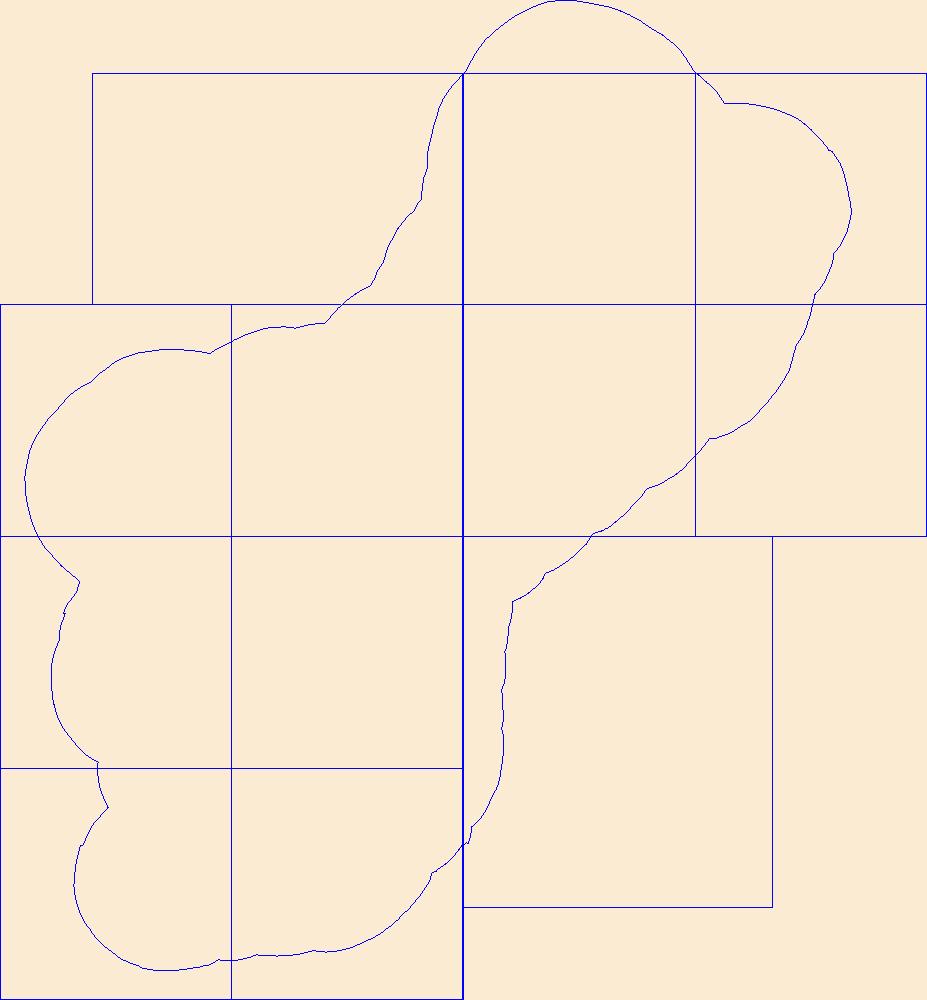
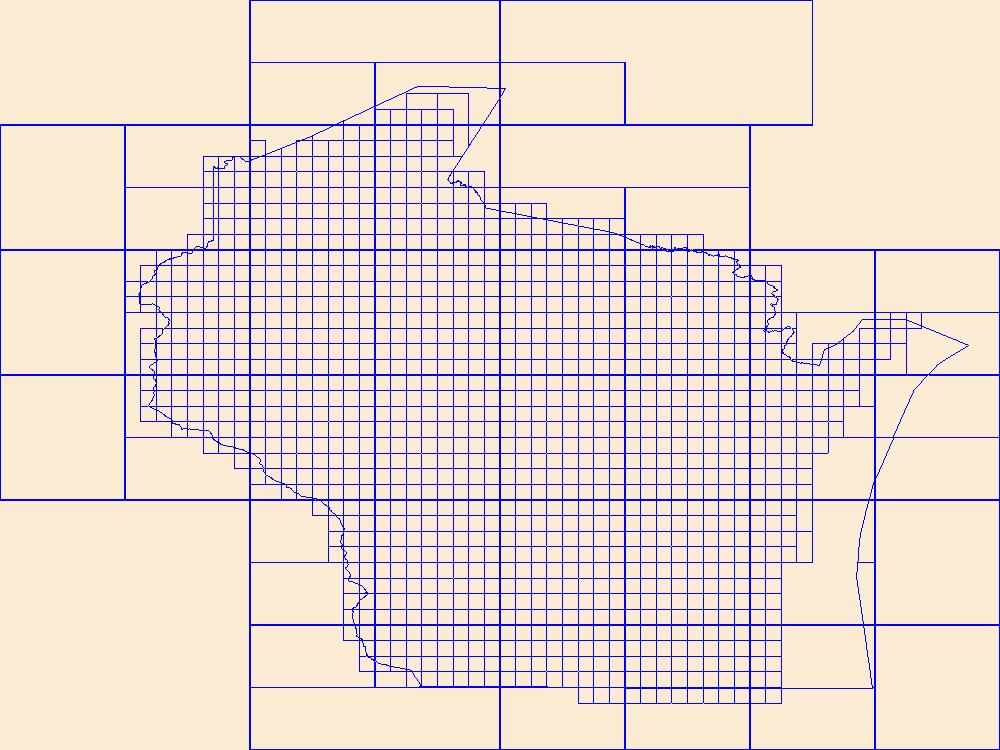
This data represents the map extent for current and historical USGS topographic maps for the United States and Territories, including 1 X 2 Degree, 1 X 1 Degree, 30 X 60 Minute, 15 X 15 Minute, 7.5 X 7.5 Minute, and 3.75 X 3.75 Minute. The grid was generated using ESRI ArcInfo GIS software.
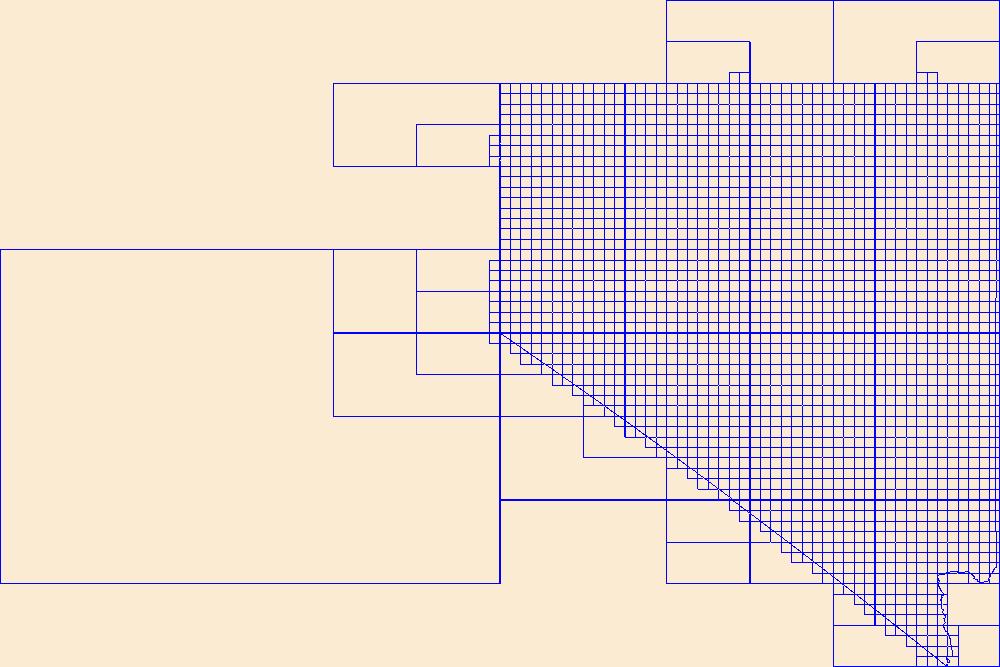
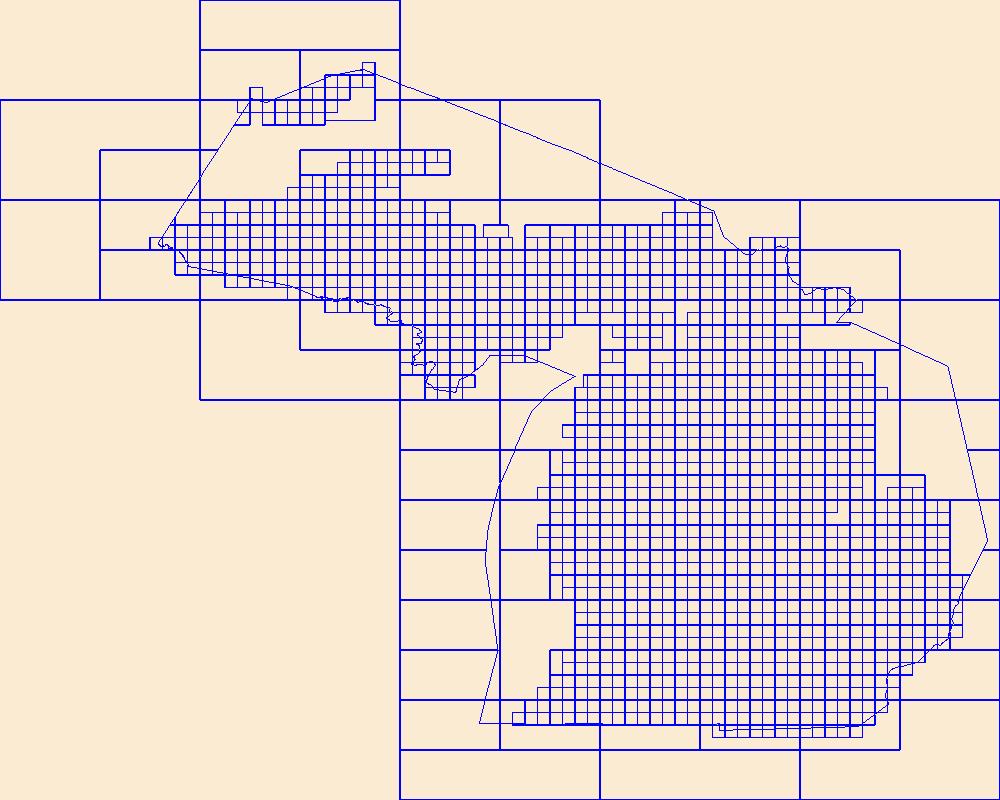
This data represents the map extent for current and historical USGS topographic maps for the United States and Territories, including 1 X 2 Degree, 1 X 1 Degree, 30 X 60 Minute, 15 X 15 Minute, 7.5 X 7.5 Minute, and 3.75 X 3.75 Minute. The grid was generated using ESRI ArcInfo GIS software.
These data were released prior to the October 1, 2016 effective date for the USGS’s policy dictating the review, approval, and release of scientific data as referenced in USGS Survey Manual Chapter 502.8 Fundamental Science Practices: Review and Approval of Scientific Data for Release. These datasets consist of a workspace (folder) containing a collection of gridded datasets plus a personal geodatabase containing several vector datasets. These datasets are designed to be used with the ArcHydro Tools, developed by ESRI in partnership with the U.S. Geological Survey, StreamStats Development Team. The datasets, together with the ArcHydro Tools, allow users to delineate watersheds and compute several watershed characteristics....
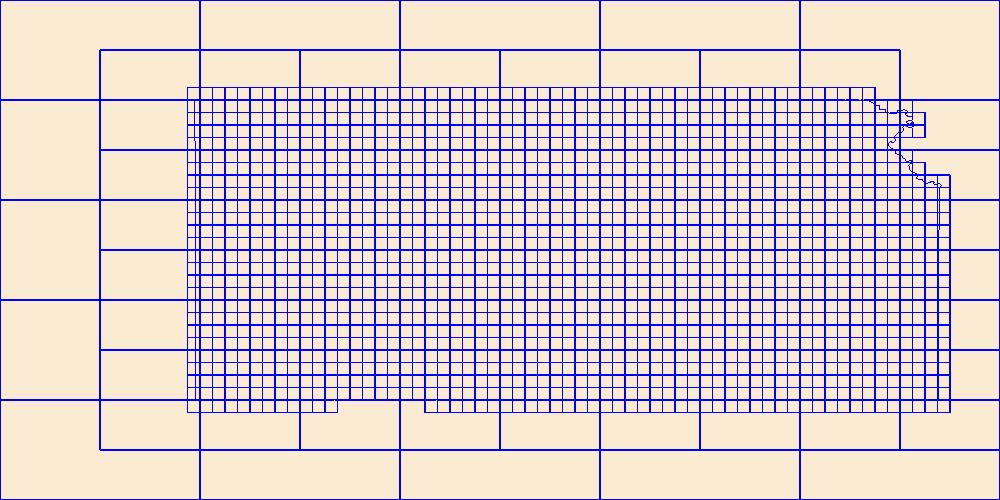
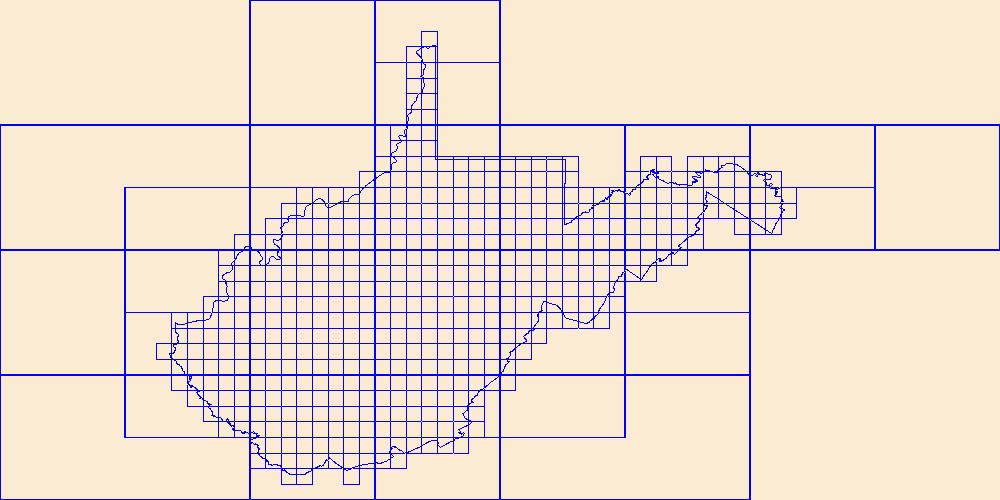
This data represents the map extent for current and historical USGS topographic maps for the United States and Territories, including 1 X 2 Degree, 1 X 1 Degree, 30 X 60 Minute, 15 X 15 Minute, 7.5 X 7.5 Minute, and 3.75 X 3.75 Minute. The grid was generated using ESRI ArcInfo GIS software.
This data represents the map extent for current and historical USGS topographic maps for the United States and Territories, including 1 X 2 Degree, 1 X 1 Degree, 30 X 60 Minute, 15 X 15 Minute, 7.5 X 7.5 Minute, and 3.75 X 3.75 Minute. The grid was generated using ESRI ArcInfo GIS software.
This data represents the map extent for current and historical USGS topographic maps for the United States and Territories, including 1 X 2 Degree, 1 X 1 Degree, 30 X 60 Minute, 15 X 15 Minute, 7.5 X 7.5 Minute, and 3.75 X 3.75 Minute. The grid was generated using ESRI ArcInfo GIS software.
This data represents the map extent for current and historical USGS topographic maps for the United States and Territories, including 1 X 2 Degree, 1 X 1 Degree, 30 X 60 Minute, 15 X 15 Minute, 7.5 X 7.5 Minute, and 3.75 X 3.75 Minute. The grid was generated using ESRI ArcInfo GIS software.
This data represents the map extent for current and historical USGS topographic maps for the United States and Territories, including 1 X 2 Degree, 1 X 1 Degree, 30 X 60 Minute, 15 X 15 Minute, 7.5 X 7.5 Minute, and 3.75 X 3.75 Minute. The grid was generated using ESRI ArcInfo GIS software.
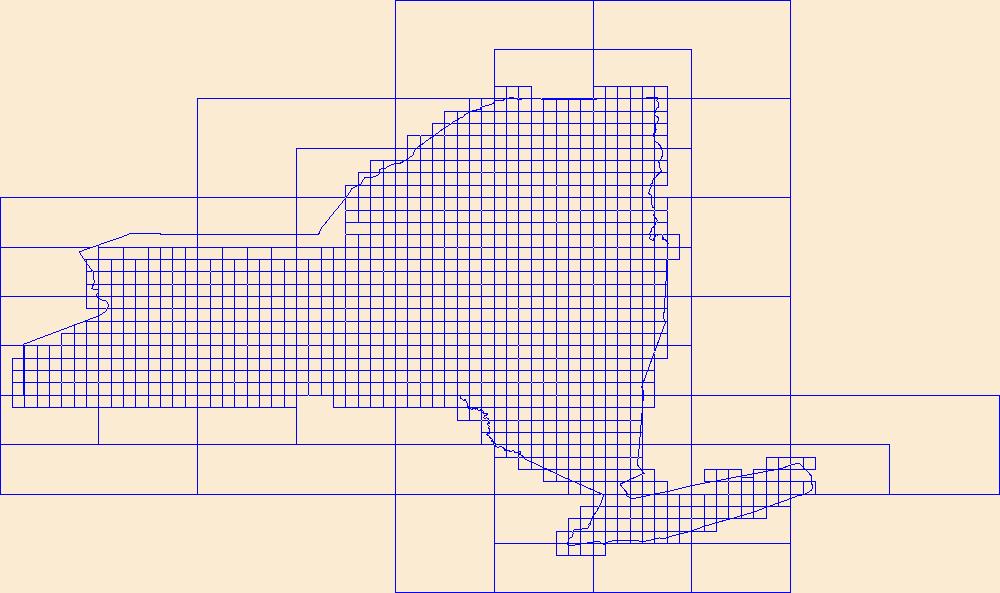
This data represents the map extent for current and historical USGS topographic maps for the United States and Territories, including 1 X 2 Degree, 1 X 1 Degree, 30 X 60 Minute, 15 X 15 Minute, 7.5 X 7.5 Minute, and 3.75 X 3.75 Minute. The grid was generated using ESRI ArcInfo GIS software.

This data represents the map extent for current and historical USGS topographic maps for the United States and Territories, including 1 X 2 Degree, 1 X 1 Degree, 30 X 60 Minute, 15 X 15 Minute, 7.5 X 7.5 Minute, and 3.75 X 3.75 Minute. The grid was generated using ESRI ArcInfo GIS software.
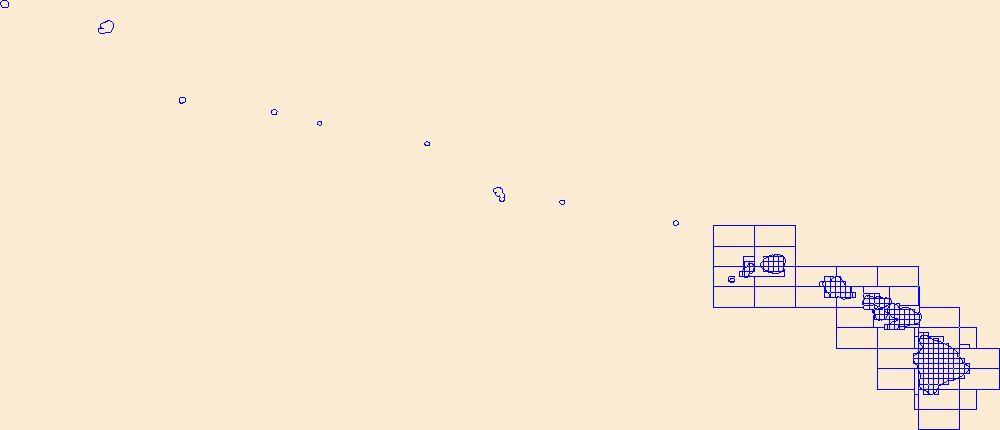
This data represents the map extent for current and historical USGS topographic maps for the United States and Territories, including 1 X 2 Degree, 1 X 1 Degree, 30 X 60 Minute, 15 X 15 Minute, 7.5 X 7.5 Minute, and 3.75 X 3.75 Minute. The grid was generated using ESRI ArcInfo GIS software.
This feature class was created to assemble oil and gas well information for a comprehensive inventory of energy data pertinent to the Wyoming Landscape Conservation Initiative decision-making process. These data are available as online resources for scientists, resource managers engaged in the Initiative, and other researchers. The GIS data and map services created for this study are available for interactive analysis and/or download at the Energy Geoscience Center WLCI website.
Categories: Data,
pre-SM502.8;
Types: Downloadable,
Map Service,
OGC WFS Layer,
OGC WMS Layer,
Shapefile;
Tags: 503702 = Mowry Composite Total Petroleum System,
50370261 = Mowry Continuous Gas,
503704 = Hilliard-Baxter-Mancos Total Petroleum System,
50370461 = Hilliard-Baxter-Mancos Continuous Gas,
503705 = Mesaverde Total Petroleum System,
Following an explosion at the Deepwater Horizon drilling rig on April 20, 2010, MC252 an estimated 3.19 million barrels of oil leaked into the Northern Gulf of Mexico over 87 days. The endangered Kemp's ridley sea turtle (Lepidochelys kempii [Lk]) has a long established record of using the area near the well as primary foraging grounds. Resulting short- and long-term negative impacts of the oil spill on sea turtles could induce changes in the health and fitness of the Lk population. MC252 oil is known to have entered the foraging areas. Consequently, stable carbon and nitrogen isotope signatures from MC252 oil should be reflected in the food web and in the tissues of organisms such as sea turtles. We measured carbon...
Orthorectified image from aerial photograph of wetland T9 in the Cottonwood Lake Study Area, Stutsman County, North Dakota. This image is part of a collection of photographs of the study area acquired during July and early August from 1975 to 2015.
Orthorectified image from aerial photograph of wetland T5 from 2003 in the Cottonwood Lake Study Area, Stutsman County, North Dakota. This image is part of a collection of photographs of the study area acquired during July and early August from 1975 to 2015.
Orthorectified image from aerial photograph of wetland T6 in the Cottonwood Lake Study Area, Stutsman County, North Dakota. This image is part of a collection of photographs of the study area acquired during July and early August from 1975 to 2015.
Orthorectified image from aerial photograph of wetland T6 in the Cottonwood Lake Study Area, Stutsman County, North Dakota. This image is part of a collection of photographs of the study area acquired during July and early August from 1975 to 2015.
Orthorectified image from aerial photograph of wetland P11 in the Cottonwood Lake Study Area, Stutsman County, North Dakota. This image is part of a collection of photographs of the study area acquired during July and early August from 1975 to 2015.
Orthorectified image from aerial photograph of wetlands T4, T5, T6, and T7 in the Cottonwood Lake Study Area, Stutsman County, North Dakota. This image is part of a collection of photographs of the study area acquired during July and early August from 1975 to 2015.
|

|
