Filters: Tags: Valencia County (X)
132 results (149ms)|
Filters
Date Range
Types Contacts
Categories Tag Types
|
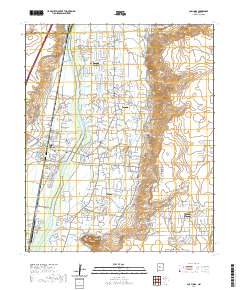
RIO GRANDE AT ISLETA, NM
RIO GRANDE AT ISLETA, NM
RIO GRANDE AT ISLETA, NM
RIO GRANDE AT ISLETA, NM
RIO GRANDE AT ISLETA, NM
RIO GRANDE AT ISLETA, NM
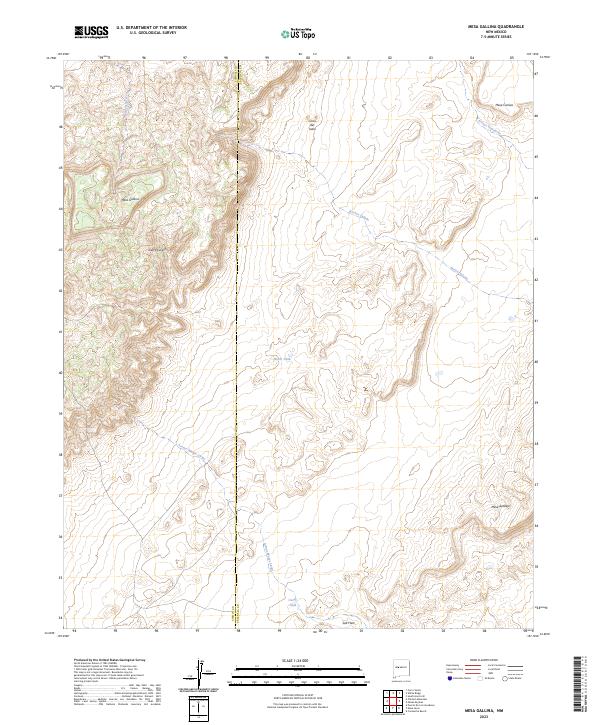
Layered geospatial PDF 7.5 Minute Quadrangle Map. Layers of geospatial data include orthoimagery, roads, grids, geographic names, elevation contours, hydrography, and other selected map features. This map is derived from GIS (geospatial information system) data. It represents a repackaging of GIS data in traditional map form, not creation of new information. The geospatial data in this map are from selected National Map data holdings and other government sources.
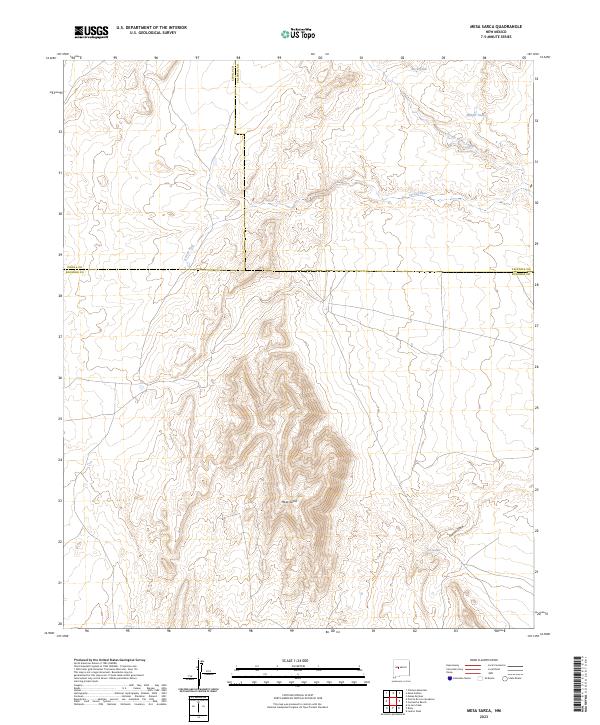
Layered geospatial PDF 7.5 Minute Quadrangle Map. Layers of geospatial data include orthoimagery, roads, grids, geographic names, elevation contours, hydrography, and other selected map features. This map is derived from GIS (geospatial information system) data. It represents a repackaging of GIS data in traditional map form, not creation of new information. The geospatial data in this map are from selected National Map data holdings and other government sources.
Layered geospatial PDF 7.5 Minute Quadrangle Map. Layers of geospatial data include orthoimagery, roads, grids, geographic names, elevation contours, hydrography, and other selected map features. This map is derived from GIS (geospatial information system) data. It represents a repackaging of GIS data in traditional map form, not creation of new information. The geospatial data in this map are from selected National Map data holdings and other government sources.
Layered geospatial PDF 7.5 Minute Quadrangle Map. Layers of geospatial data include orthoimagery, roads, grids, geographic names, elevation contours, hydrography, and other selected map features. This map is derived from GIS (geospatial information system) data. It represents a repackaging of GIS data in traditional map form, not creation of new information. The geospatial data in this map are from selected National Map data holdings and other government sources.
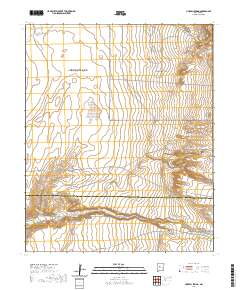
Layered geospatial PDF 7.5 Minute Quadrangle Map. Layers of geospatial data include orthoimagery, roads, grids, geographic names, elevation contours, hydrography, and other selected map features. This map is derived from GIS (geospatial information system) data. It represents a repackaging of GIS data in traditional map form, not creation of new information. The geospatial data in this map are from selected National Map data holdings and other government sources.
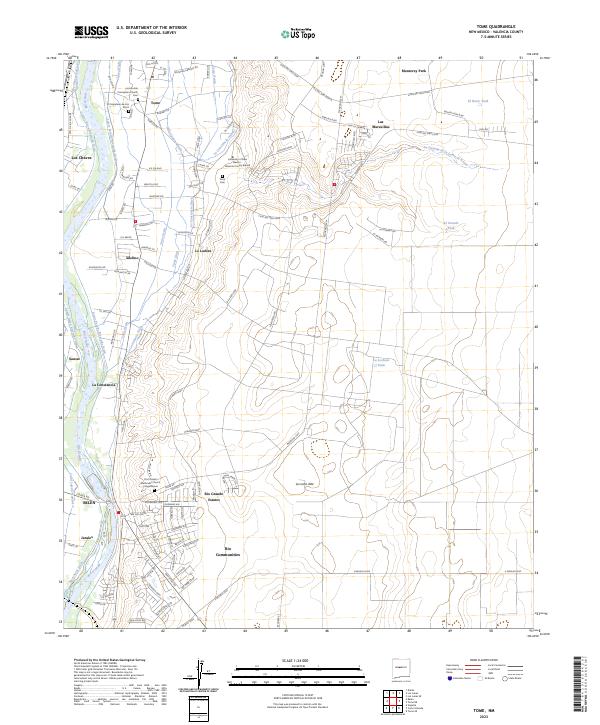
Layered geospatial PDF 7.5 Minute Quadrangle Map. Layers of geospatial data include orthoimagery, roads, grids, geographic names, elevation contours, hydrography, and other selected map features. This map is derived from GIS (geospatial information system) data. It represents a repackaging of GIS data in traditional map form, not creation of new information. The geospatial data in this map are from selected National Map data holdings and other government sources.
This part of the Data Release contains the raster representation of the water-level altitude and water-level change maps developed every 5 years from 1980-2015 for the upper Rio Grande Focus Area Study. The input point data used to generate the water-level altitude maps can be found in the "Groundwater level measurement data used to develop water-level altitude maps in the upper Rio Grande Alluvial Basins" child item of this data release. These digital data accompany Houston, N.A., Thomas, J.V., Foster, L.K., Pedraza, D.E., and Welborn, T.L., 2020, Hydrogeologic framework, groundwater-level altitudes, groundwater-level changes, and groundwater-storage changes in selected alluvial basins of the upper Rio Grande...
Types: Map Service,
OGC WFS Layer,
OGC WMS Layer,
OGC WMS Service;
Tags: Abiquiu Reservoir,
Ahumada,
Alamosa,
Alamosa County,
Alamosa Creek,
The 1935 images were obtained as digitally scanned versions of aerial photographs acquired by the U.S. Department of Agriculture at a scale of 1:31,680. The actual date of image acquisition is not known. The images were previously scanned at 600 dpi to produce a nominal pixel size of 1.28 m (Friedman et al., 2015). The images were registered and rectified using identifiable common points from the 1996 DOQQs. See description of positional accuracy below. Data derived from features mapped from the 1935 images were presented in: Friedman, J.M., Vincent, K.R., Griffin, E.R., Scott, M.L., Shafroth, P.B., and Auble, G.T., 2015, Processes of arroyo filling in northern New Mexico, USA, GSA Bulletin, 127(3/4), 621-640....
RIO GRANDE AT ISLETA, NM
RIO GRANDE AT ISLETA, NM
RIO GRANDE AT ISLETA, NM
RIO GRANDE AT ISLETA, NM
RIO GRANDE AT ISLETA, NM
|

|
