Filters: Tags: Wisconsin (X)
9,489 results (330ms)|
Filters
Date Range
Extensions Types
Contacts
Categories Tag Types
|
High radium (Ra) concentrations in potable portions of the Cambrian-Ordovician (C-O) aquifer system were investigated using water-quality data and environmental tracers ( 3H, 3Hetrit, SF6 , 14C and 4Herad) of groundwater age from 80 public-supply wells (PSWs). Groundwater ages were estimated by calibration of tracers to lumped parameter models and ranged from modern (1 Myr) in the most downgradient, confined portions of the potable system. More than 80 and 40 percent of mean groundwater ages were older than 1000 and 50,000 yr, respectively. Anoxic, Fe-reducing conditions and increased mineralization develop with time in the aquifer system and mobilize Ra into solution resulting in the frequent occurrence of combined...
The glacial aquifer system of the United States encompasses all or parts of 25 states and is the most widely used supply of drinking water in the Nation (Maupin and Barber, 2005; Maupin and Arnold, 2010). A series of seven raster data sets were derived from a database of water-well drillers' records that was compiled in partial fulfillment of the goals of the U.S. Geological Survey’s Groundwater Availability and Use assessment program (U.S. Geological Survey, 2002). They contain hydrogeologic information for areas of the U.S. that are north of the southern limit of Pleistocene glaciation, including the total thickness of glacial deposits, thickness of coarse-grained sediment within the glacial deposits, specific-capacity...
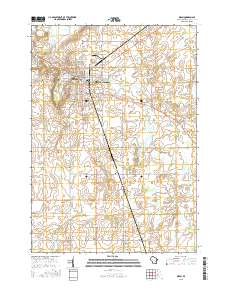
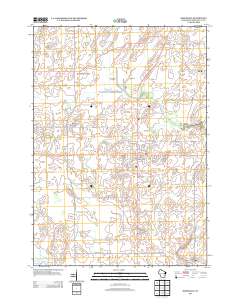
Layers of geospatial data include contours, boundaries, land cover, hydrography, roads, transportation, geographic names, structures, and other selected map features.

This map layer consists of federally owned or administered lands of the United States, Puerto Rico, and the U.S. Virgin Islands. For the most part, only areas of 320 acres or more are included; some smaller areas deemed to be important or significant are also included. There may be private inholdings within the boundaries of Federal lands in this map layer. Some established Federal lands which are larger than 320 acres are not included in this map layer, because their boundaries were not available from the owning or administering agency.
The 'Northern Wisconsin, Wausau Area' file is part of the Grover Heinrichs mining collection. Grover was the Vice President of Heinrichs GEOEXploration, located in Tucson, Arizona. The collection contains over 1,400 folders including economic geology reports, maps, photos, correspondence, drill logs and other related materials. The focus of much of the information is on the western United States, particularly Arizona, but the collection also includes files on mining activity throughout the United States, foreign countries, and 82 mineral commodities.
Categories: Data;
Tags: Dataset,
United States,
Wisconsin,
geoscientificInformation,
mineral resources,
Layers of geospatial data include contours, boundaries, land cover, hydrography, roads, transportation, geographic names, structures, and other selected map features.
Types: Citation;
Tags: 7.5 x 7.5 minute,
7.5 x 7.5 minute,
Boone County,
Combined Vector,
Combined Vector,
This dataset provides timeseries data on water quality and quantity, as collected or computed from outside sources. The format is many tables with one row per time series observation (1 tab-delimited file per site-variable combination, 1 zip file per site). This compilation of data is intended for use in estimating or interpreting metabolism. Sites were included if they met the initial criteria of having at least 100 dissolved oxygen observations and one of the accepted NWIS site types ('ST','ST-CA','ST-DCH','ST-TS', or 'SP'). This dataset is part of a larger data release of metabolism model inputs and outputs for 356 streams and rivers across the United States (https://doi.org/10.5066/F70864KX). The complete release...
The glacial aquifer system of the United States encompasses all or parts of 25 states and is the most widely used supply of drinking water in the Nation (Maupin and Barber, 2005; Maupin and Arnold, 2010). A series of seven raster data sets were derived from a database of water-well drillers' records that was compiled in partial fulfillment of the goals of the U.S. Geological Survey’s Groundwater Availability and Use assessment program (U.S. Geological Survey, 2002). They contain hydrogeologic information for areas of the U.S. that are north of the southern limit of Pleistocene glaciation, including the total thickness of glacial deposits, thickness of coarse-grained sediment within the glacial deposits, specific-capacity...
Layers of geospatial data include contours, boundaries, land cover, hydrography, roads, transportation, geographic names, structures, and other selected map features.
Types: Citation;
Tags: 7.5 x 7.5 minute,
7.5 x 7.5 minute,
Combined Vector,
Combined Vector,
Combined Vector,

This map layer shows Indian lands of the United States. For the most part, only areas of 320 acres or more are included; some smaller areas deemed to be important or significant are also included. Federally-administered lands within a reservation are included for continuity; these may or may not be considered part of the reservation and are simply described with their feature type and the administrating Federal agency. Some established Indian lands which are larger than 320 acres are not included in this map layer because their boundaries were not available from the owning or administering agency.
Geographic distribution data were collected based on county level occurrences (or converted from point occurrences to county level occurrences) within the five focal states (Minnesota, North Dakota, South Dakota, Nebraska & Iowa) and each U.S. state or Canadian province bordering those focal states (Wisconsin, Illinois, Missouri, Kansas, Wyoming, & Montana in the USA and Saskatchewan, Ontario & Manitoba in Canada).
These vector contour lines are derived from the 3D Elevation Program using automated and semi-automated processes. They were created to support 1:24,000-scale CONUS and Hawaii, 1:25,000-scale Alaska, and 1:20,000-scale Puerto Rico / US Virgin Island topographic map products, but are also published in this GIS vector format. Contour intervals are assigned by 7.5-minute quadrangle, so this vector dataset is not visually seamless across quadrangle boundaries. The vector lines have elevation attributes (in feet above mean sea level on NAVD88), but this dataset does not carry line symbols or annotation.
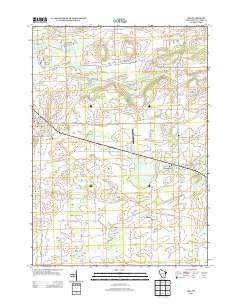
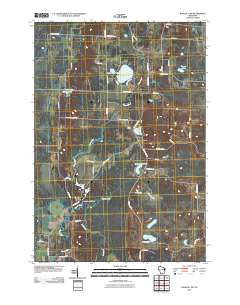
Layered GeoPDF 7.5 Minute Quadrangle Map. Layers of geospatial data include orthoimagery, roads, grids, geographic names, elevation contours, hydrography, and other selected map features.
Layered GeoPDF 7.5 Minute Quadrangle Map. Layers of geospatial data include orthoimagery, roads, grids, geographic names, elevation contours, hydrography, and other selected map features.
Layered GeoPDF 7.5 Minute Quadrangle Map. Layers of geospatial data include orthoimagery, roads, grids, geographic names, elevation contours, hydrography, and other selected map features.
Layered GeoPDF 7.5 Minute Quadrangle Map. Layers of geospatial data include orthoimagery, roads, grids, geographic names, elevation contours, hydrography, and other selected map features.
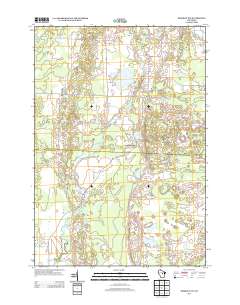
Layered GeoPDF 7.5 Minute Quadrangle Map. Layers of geospatial data include orthoimagery, roads, grids, geographic names, elevation contours, hydrography, and other selected map features.
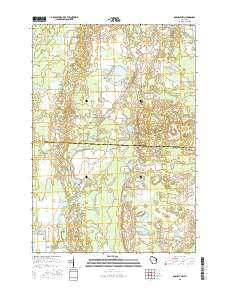
Layered GeoPDF 7.5 Minute Quadrangle Map. Layers of geospatial data include orthoimagery, roads, grids, geographic names, elevation contours, hydrography, and other selected map features.
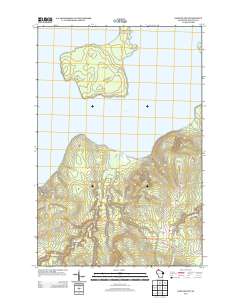
Layered GeoPDF 7.5 Minute Quadrangle Map. Layers of geospatial data include orthoimagery, roads, grids, geographic names, elevation contours, hydrography, and other selected map features.
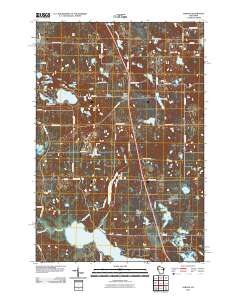
Layered GeoPDF 7.5 Minute Quadrangle Map. Layers of geospatial data include orthoimagery, roads, grids, geographic names, elevation contours, hydrography, and other selected map features.
|

|
