Filters: Tags: Wyoming (X)
15,048 results (323ms)|
Filters
Date Range
Extensions Types Contacts
Categories Tag Types
|
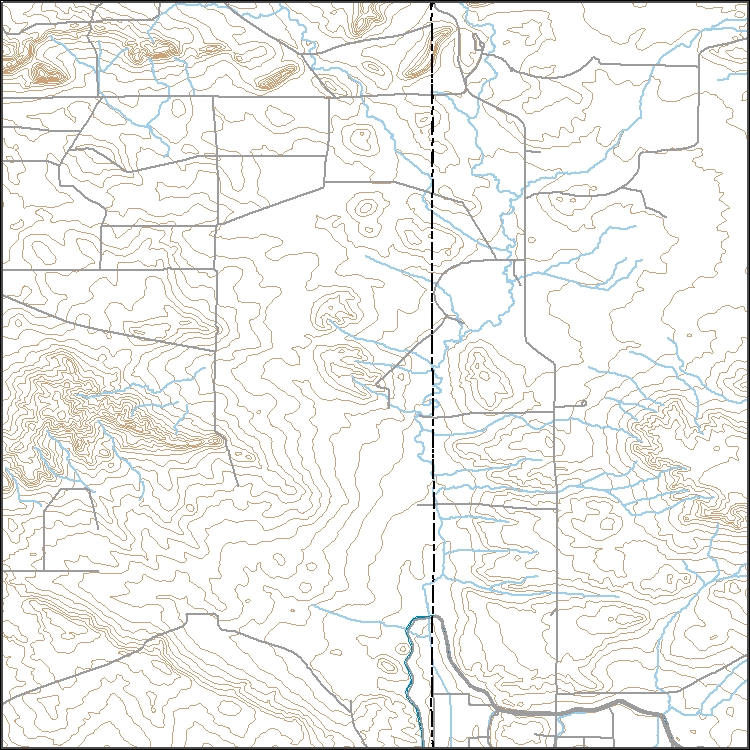
Distance to the nearest road.
Layers of geospatial data include contours, boundaries, land cover, hydrography, roads, transportation, geographic names, structures, and other selected map features.
Types: Citation;
Tags: 7.5 x 7.5 minute,
7.5 x 7.5 minute,
Bear Lake County,
Caribou County,
Combined Vector,
All roads in the western United States from the 2000 US Census Bureau 1:100,000 scale TIGER/line files.
Categories: Data;
Types: Downloadable,
Map Service,
OGC WFS Layer,
OGC WMS Layer,
Shapefile;
Tags: Arizona,
California,
Census 2000,
Colorado,
Idaho,
Proportion of all sagebrush species land cover within a 1-km radius developed using a circular focal moving window analysis.
Categories: Data;
Types: Downloadable,
GeoTIFF,
Map Service,
Raster;
Tags: Artemisia spp.,
Colorado,
Idaho,
Montana,
United States,
Proportion of salt desert shrub land cover within a 1-km radius developed using a circular focal moving window analysis.
These vector contour lines are derived from the 3D Elevation Program using automated and semi-automated processes. They were created to support 1:24,000-scale CONUS and Hawaii, 1:25,000-scale Alaska, and 1:20,000-scale Puerto Rico / US Virgin Island topographic map products, but are also published in this GIS vector format. Contour intervals are assigned by 7.5-minute quadrangle, so this vector dataset is not visually seamless across quadrangle boundaries. The vector lines have elevation attributes (in feet above mean sea level on NAVD88), but this dataset does not carry line symbols or annotation.
Models that treat innovations to the price of energy as predetermined with respect to U.S. macroeconomic aggregates are widely used in the literature. For example, it is common to order energy prices first in recursively identified VAR models of the transmission of energy price shocks. Because exactly identifying assumptions are inherently untestable, this approach in practice has required an act of faith in the empirical plausibility of the delay restriction used for identification. An alternative view that would invalidate such models is that energy prices respond instantaneously to macroeconomic news, implying that energy prices should be ordered last in recursively identified VAR models. In this paper, we propose...
Categories: Publication;
Types: Citation;
Tags: Powder River Basin,
Wyoming,
analysis,
coal,
development,
The purpose of the pilot project is to trial different methods and vendors of wind power forecasting to determine the best approach to forecasting wind power in Alberta in the future. Three vendors were chosen with global forecasting experience; AWS Truewind (New York), energy & meteo systems (Germany), and WEPROG (Denmark). Each vendor will forecast for 12 geographically dispersed wind power facilities for a year (May 07 to May 08) providing a forecast covering the next 48 hours refreshed hourly. ORTECH Power was chosen to perform the quantitative analysis of the results analyzing methods, timeframes and geographical locations. Phoenix Engineering was chosen to collect all the necessary meteorological data required...
The mine permit boundary coverage was created for locational purposes and to aid counties in tax district assessment.
Layers of geospatial data include contours, boundaries, land cover, hydrography, roads, transportation, geographic names, structures, and other selected map features.
Future climates are simulated by general circulation models (GCM) using climate change scenarios (IPCC 2014). To project climate change for the sagebrush biome, we used 11 GCMs and two climate change scenarios from the IPCC Fifth Assessment, representative concentration pathways (RCPs) 4.5 and 8.5 (Moss et al. 2010, Van Vuuren et al. 2011). RCP4.5 scenario represents a future where climate policies limit and achieve stabilization of greenhouse gas concentrations to 4.5 W m-2 by 2100. RCP8.5 scenario might be called a business-as-usual scenario, where high emissions of greenhouse gases continue in the absence of climate change policies. The two selected time frames allow comparison of near-term (2020-2050) and longer-term...
Categories: Data;
Types: Citation,
Downloadable,
GeoTIFF,
Map Service,
Raster;
Tags: Arizona,
CRS,
California,
Climate,
Colorado,
Layers of geospatial data include contours, boundaries, land cover, hydrography, roads, transportation, geographic names, structures, and other selected map features.
This dataset provides timeseries data on water quality and quantity, as collected or computed from outside sources. The format is many tables with one row per time series observation (1 tab-delimited file per site-variable combination, 1 zip file per site). This compilation of data is intended for use in estimating or interpreting metabolism. Sites were included if they met the initial criteria of having at least 100 dissolved oxygen observations and one of the accepted NWIS site types ('ST','ST-CA','ST-DCH','ST-TS', or 'SP'). This dataset is part of a larger data release of metabolism model inputs and outputs for 356 streams and rivers across the United States (https://doi.org/10.5066/F70864KX). The complete release...
Layers of geospatial data include contours, boundaries, land cover, hydrography, roads, transportation, geographic names, structures, and other selected map features.
Categories: Data;
Types: Downloadable,
GeoTIFF,
Map Service,
Raster;
Tags: Aquatic Habitat,
Energy Development,
IA,
Landscape-Scale Conservation,
SW Wyoming,
Categories: Data;
Types: Downloadable,
GeoTIFF,
Map Service,
Raster;
Tags: Aquatic Habitat,
Energy Development,
IA,
Landscape-Scale Conservation,
SW Wyoming,
Categories: Data;
Types: Downloadable,
GeoTIFF,
Map Service,
Raster;
Tags: Aquatic Habitat,
Energy Development,
IA,
Landscape-Scale Conservation,
SW Wyoming,
A new species of poplar is recognized based on abundant specimens from the early Middle Eocene Parachute Creek Member of the Green River Formation in eastern Utah and western Colorado and compared with two other contemporary species. A rare twig bearing both leaves and fruits serves as a Rosetta stone, linking the vegetative and reproductive structures that formerly were only known from dispersed organs. Fruit and foliage characters distinguish Populus tidwellii sp. n. from Populus cinnamomoides (Lesquereux) MacGinitie (typified on specimens from Green River Station, WY), to which the isolated leaves had formerly been attributed. In addition, new data from fruits and foliage confirm that there were two distinct...
Categories: Publication;
Types: Citation,
Journal Citation;
Tags: Colorado,
International Journal of Plant Sciences,
Montana,
Populus,
Pseudosalix,
|

|
