Filters: Tags: Wyoming (X)
15,047 results (644ms)|
Filters
Date Range
Extensions Types Contacts
Categories Tag Types
|
This shapefile is the official boundary of the Western Native Trout Initiative. The boundary was originally developed by the United States Fish and Wildlife Service and was updated in 2013 to reflect revisions from the Western Native Trout Initiative, a recognized Fish Habitat Partnership (FHP) of the National Fish Habitat Partnership.
Categories: Data;
Types: ArcGIS REST Map Service,
ArcGIS Service Definition,
Downloadable,
Map Service;
Tags: Alaska,
Analytical boundary,
Aquatic habitats,
Arizona,
Boundaries,
Layers of geospatial data include contours, boundaries, land cover, hydrography, roads, transportation, geographic names, structures, and other selected map features.
Types: Citation;
Tags: 7.5 x 7.5 minute,
7.5 x 7.5 minute,
Carbon County,
Combined Vector,
Combined Vector,
These data represent simulated soil temperature and moisture conditions for current climate, and for future climate represented by all available climate models at two time periods during the 21st century. These data were used to: 1) quantify the direction and magnitude of expected changes in several measures of soil temperature and soil moisture, including the key variables used to distinguish the regimes used in the R and R categories; 2) assess how these changes will impact the geographic distribution of soil temperature and moisture regimes; and 3) explore the implications for using R and R categories for estimating future ecosystem resilience and resistance.

This map layer shows Indian lands of the United States. For the most part, only areas of 320 acres or more are included; some smaller areas deemed to be important or significant are also included. Federally-administered lands within a reservation are included for continuity; these may or may not be considered part of the reservation and are simply described with their feature type and the administrating Federal agency. Some established Indian lands which are larger than 320 acres are not included in this map layer because their boundaries were not available from the owning or administering agency.
Map containing historical census data from 1900 - 2000 throughout the western United States at the county level. Data includes total population, population density, and percent population change by decade for each county. Population data was obtained from the US Census Bureau and joined to 1:2,000,000 scale National Atlas counties shapefile.
Categories: Data;
Types: Downloadable,
Map Service,
OGC WFS Layer,
OGC WMS Layer,
Shapefile;
Tags: Arizona,
California,
Colorado,
Idaho,
Montana,
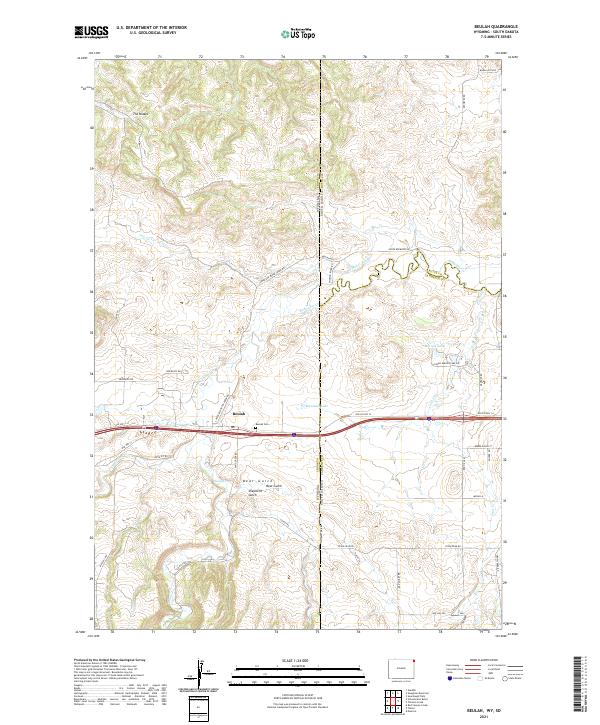
Layered geospatial PDF 7.5 Minute Quadrangle Map. Layers of geospatial data include orthoimagery, roads, grids, geographic names, elevation contours, hydrography, and other selected map features. This map is derived from GIS (geospatial information system) data. It represents a repackaging of GIS data in traditional map form, not creation of new information. The geospatial data in this map are from selected National Map data holdings and other government sources.
Geographic distribution data were collected based on county level occurrences (or converted from point occurrences to county level occurrences) within the five focal states (Minnesota, North Dakota, South Dakota, Nebraska & Iowa) and each U.S. state or Canadian province bordering those focal states (Wisconsin, Illinois, Missouri, Kansas, Wyoming, & Montana in the USA and Saskatchewan, Ontario & Manitoba in Canada).
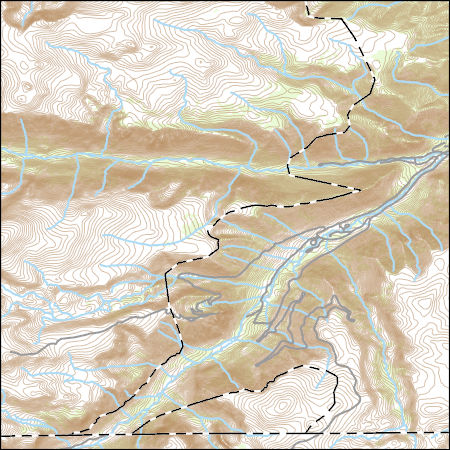
These vector contour lines are derived from the 3D Elevation Program using automated and semi-automated processes. They were created to support 1:24,000-scale CONUS and Hawaii, 1:25,000-scale Alaska, and 1:20,000-scale Puerto Rico / US Virgin Island topographic map products, but are also published in this GIS vector format. Contour intervals are assigned by 7.5-minute quadrangle, so this vector dataset is not visually seamless across quadrangle boundaries. The vector lines have elevation attributes (in feet above mean sea level on NAVD88), but this dataset does not carry line symbols or annotation.
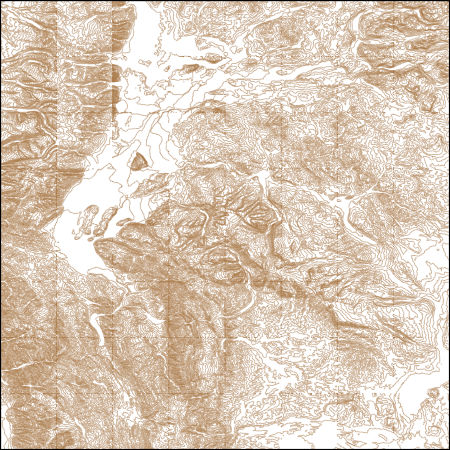
These vector contour lines are derived from the 3D Elevation Program using automated and semi-automated processes. They were created to support 1:24,000-scale CONUS and Hawaii, 1:25,000-scale Alaska, and 1:20,000-scale Puerto Rico / US Virgin Island topographic map products, but are also published in this GIS vector format. Contour intervals are assigned by 7.5-minute quadrangle, so this vector dataset is not visually seamless across quadrangle boundaries. The vector lines have elevation attributes (in feet above mean sea level on NAVD88), but this dataset does not carry line symbols or annotation.
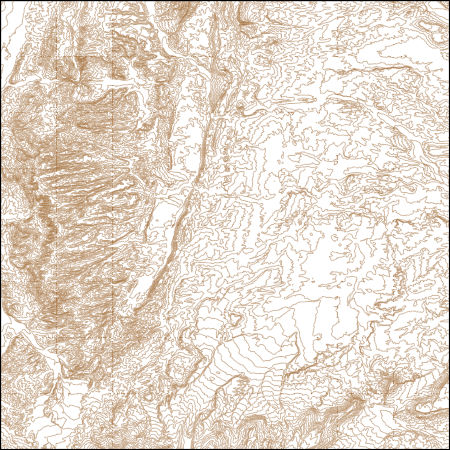
These vector contour lines are derived from the 3D Elevation Program using automated and semi-automated processes. They were created to support 1:24,000-scale CONUS and Hawaii, 1:25,000-scale Alaska, and 1:20,000-scale Puerto Rico / US Virgin Island topographic map products, but are also published in this GIS vector format. Contour intervals are assigned by 7.5-minute quadrangle, so this vector dataset is not visually seamless across quadrangle boundaries. The vector lines have elevation attributes (in feet above mean sea level on NAVD88), but this dataset does not carry line symbols or annotation.
USGS Topo Map Vector Data (Vector) 31518 Neil Butte, Wyoming 20210915 for 7.5 x 7.5 minute Shapefile
Layers of geospatial data include contours, boundaries, land cover, hydrography, roads, transportation, geographic names, structures, and other selected map features.
Layers of geospatial data include contours, boundaries, land cover, hydrography, roads, transportation, geographic names, structures, and other selected map features.
Layers of geospatial data include contours, boundaries, land cover, hydrography, roads, transportation, geographic names, structures, and other selected map features.
Layers of geospatial data include contours, boundaries, land cover, hydrography, roads, transportation, geographic names, structures, and other selected map features.
Layers of geospatial data include contours, boundaries, land cover, hydrography, roads, transportation, geographic names, structures, and other selected map features.
Layers of geospatial data include contours, boundaries, land cover, hydrography, roads, transportation, geographic names, structures, and other selected map features.
Layered GeoPDF 7.5 Minute Quadrangle Map. Layers of geospatial data include orthoimagery, roads, grids, geographic names, elevation contours, hydrography, and other selected map features.
Layered GeoPDF 7.5 Minute Quadrangle Map. Layers of geospatial data include orthoimagery, roads, grids, geographic names, elevation contours, hydrography, and other selected map features.
Layered GeoPDF 7.5 Minute Quadrangle Map. Layers of geospatial data include orthoimagery, roads, grids, geographic names, elevation contours, hydrography, and other selected map features.
Layered GeoPDF 7.5 Minute Quadrangle Map. Layers of geospatial data include orthoimagery, roads, grids, geographic names, elevation contours, hydrography, and other selected map features.
|

|
