Filters: Tags: environment (X)
13,602 results (37ms)|
Filters
Date Range
Extensions Types
Contacts
Categories Tag Types
|
The food webs of littoral, pelagic, and littoral-pelagic ecotone (interface) regions of a large subtropical lake were investigated using stable isotope ratio methods, expanding the focus of a previous fish-only study to include other food web components such as primary producers and invertebrates. In these food webs, delta13C increased approximately 4 per thousand and delta15N increased approximately 10 per thousand from primary producers to fish. The delta15N of fish was approximately 9 per thousand in the littoral zone, approximately 10 per thousand in the ecotone, and approximately 12 per thousand in the pelagic zone. The cross-habitat enrichment in fish 15N corresponded with both an increase in the size of fish...
Categories: Publication;
Types: Citation;
Tags: Animals,
Ecosystem,
Eleocharis,
Environme,
Environment
The central Platte River Valley represents a key mid-latitude stopover This dataset supports a contemporary analysis of nocturnal roost selection for sandhill cranes staging along the Platte River during 2003-2007. We explored variation in selection for previously established characteristics of roost sites, including river channel width, vegetation height along the river bank, and distance to nearest disturbance feature. This analysis also included novel environmental factors (yearly estimates of corn near roost sites, nightly temperature, wind speed, and river discharge) and how they may interact with the more established characteristics.
Categories: Data;
Types: Citation;
Tags: animal tracking,
biota,
birds,
environment,
fUS31 = Nebraska,
Sagebrush ecosystems in North America have experienced extensive degradation since European settlement, and continue to further degrade from exotic invasive plants, greater fire frequency, intensive grazing practices, increased oil and gas development, climate change, and other factors. Remote sensing is often identified as a key information source to facilitate broad-area ecosystem-wide characterization, monitoring and analysis, however, approaches that characterize sagebrush with sufficient and accurate local detail across large areas to support ecosystem research and analysis are unavailable. We have developed a new remote sensing sagebrush ecosystem characterization approach for the state of Wyoming, U.S.A....
This dataset represents the variety (unique structural classes: water, bare, herbaceous, short shrubs, medium shrubs, short trees, tall trees) within 1 ha of bottomland areas. Traditional image interpretation cues were used to develop the polygons, such as shape, size, pattern, tone, texture, color, and shadow, from high resolution, true color, aerial imagery (0.3m resolution), acquired for the project. Additional, public available aerial photos (NAIP, 2011) were used to cross-reference cover classes. As with any digital layer, this layer is a representation of what is actually occurring on the ground. Errors are inherent in any interpretation of ground qualities. Due to the "snapshot" nature of the aerial photos,...
Categories: Data;
Types: Citation,
Downloadable,
Map Service,
OGC WFS Layer,
OGC WMS Layer,
Shapefile;
Tags: Arches National Park,
Canyonlands National Park,
Colorado River,
Grand County,
Moab,

This part of DS 781 presents data for the Seafloor character map of the Offshore of Point Conception Map Area, California. The vector data file is included in "SeafloorCharacter_OffshorePointConception.zip," which is accessible from https://doi.org/10.5066/F7QN64XQ. This raster-format seafloor-character map shows four substrate classes in the Offshore of Point Conception map area, California. The substrate classes mapped in this area have been colored to indicate which of the following California Marine Life Protection Act depth zones and slope classes they belong: Depth Zone 2 (intertidal to 30 m), Depth Zone 3 (30 to 100 m), Depth Zone 4 (100 to 200 m), Depth Zone 5 (deeper than 200 m), Slope Class 1 (0 degrees...
Future climates are simulated by general circulation models (GCM) using climate change scenarios (IPCC 2014). To project climate change for the sagebrush biome, we used 11 GCMs and two climate change scenarios from the IPCC Fifth Assessment, representative concentration pathways (RCPs) 4.5 and 8.5 (Moss et al. 2010, Van Vuuren et al. 2011). RCP4.5 scenario represents a future where climate policies limit and achieve stabilization of greenhouse gas concentrations to 4.5 W m-2 by 2100. RCP8.5 scenario might be called a business-as-usual scenario, where high emissions of greenhouse gases continue in the absence of climate change policies. The two selected time frames allow comparison of near-term (2020-2050) and longer-term...
Categories: Data;
Types: Citation,
Downloadable,
GeoTIFF,
Map Service,
Raster;
Tags: Arizona,
CRS,
California,
Climate,
Colorado,
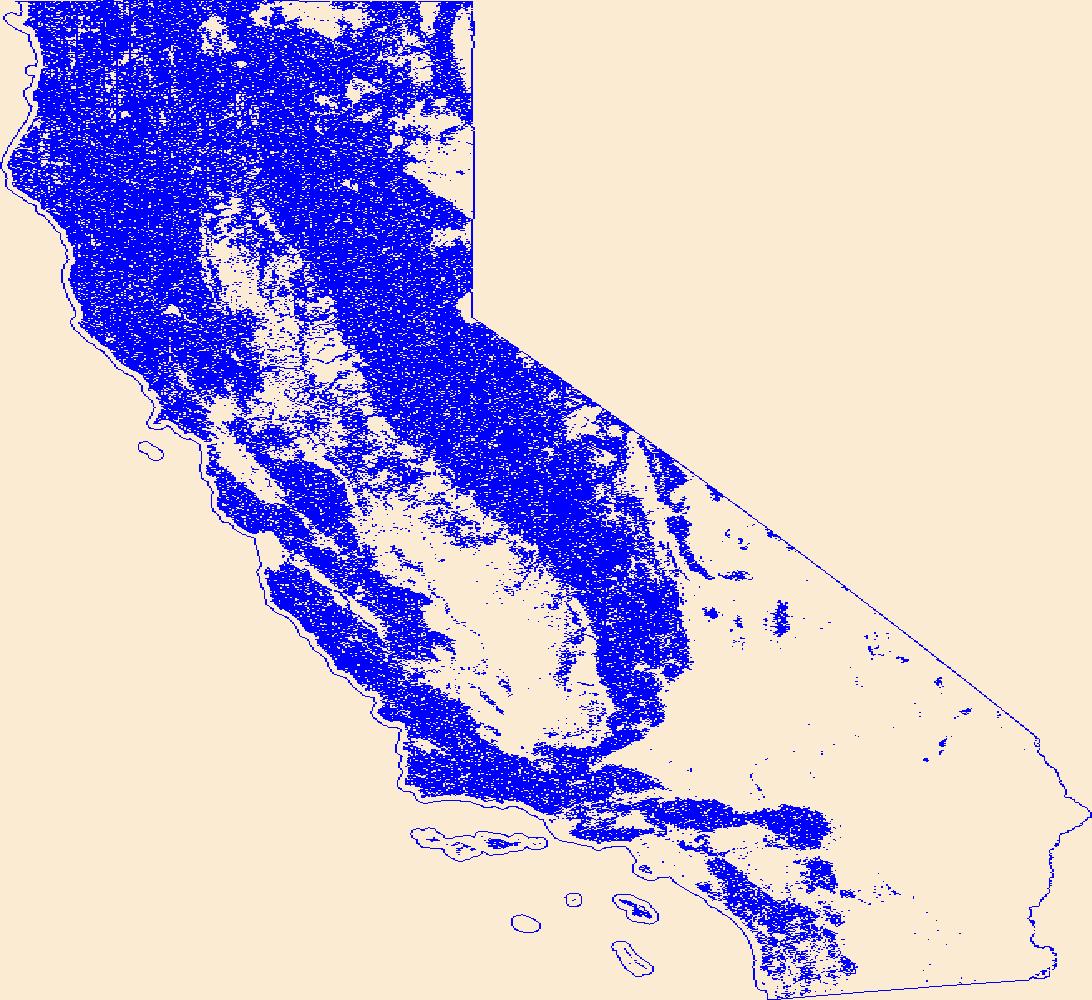
Geospatial data that is a derivative land cover product depicting woodland on topographic maps.
These data were compiled for a manuscript in which 1) we develop a water temperature model for the major river segments and tributaries of the Colorado River basin, including the Colorado, Green, Yampa, White, and San Juan rivers; 2) we link modeled water temperature to fish population data to predict the probability native and nonnative species will be common in the future in a warming climate; and 3) assess the degree to which dams create thermal discontinuity in summer in river segments across the western US. Per goal #1, we developed a water temperature model using data spanning 1985-2015 that predicts water temperature every 1 mile (1.6-km) in rivers both now and in the future due to the potential influence...
Proportion of grassland land cover within a 5-km radius developed using a circular focal moving window analysis.
Categories: Data;
Types: Downloadable,
GeoTIFF,
Map Service,
Raster;
Tags: Colorado,
Idaho,
Montana,
United States,
Utah,
The Wetland Reserve Program (WRP) is a voluntary program administered by the NRCS. It provides technical and financial assistance to private landowners and Tribes to restore, protect, and enhance wetlands in exchange for retiring eligible land from agriculture. For a site to be a wetland eligible for restoration, it must be in a zone with sustained or frequent flooding for a period of 7 consecutive days on average at least once every 2 years (a value termed the 7MQ2). This study calculated the 7MQ2 flows for all the U.S. Geological Survey streamgages within the selected study reaches. These flows were related to the stage discharge tables for each streamgage and a corresponding elevation was determined. By use of...
This Benthic Invertebrate Community Analysis dataset, a conceptual subgroup of the Lake Erie Ecological Investigations (LEEI) dataset, focuses on the benthic invertebrates sampled at Areas of Concern (AOCs) on Lake Erie. Per the Quality Assurance Project Plan (QAPP), the invertebrate samples were taken from sediments remaining from the sediment analysis. Identification of the invertebrates was completed by the same invertebrate taxonomist for both the 1998-2000 evaluation and 1986-87 historical evaluation (Smith et al. 1994) for increased consistency. Oligochaetes were identified to species if possible, chironomids were identified to genus, as adult specimens are needed for specific identification, and other taxa...
This raster represents a continuous surface of sage-grouse habitat suitability index (HSI) values for northeastern California. HSIs were calculated for spring (mid-March to June), summer (July to mid-October), and winter (November to March) sage-grouse seasons, and then multiplied together to create this composite dataset.
Categories: Data;
Types: Downloadable,
GeoTIFF,
Map Service,
Raster;
Tags: California,
Great Basin,
Greater Sage-Grouse,
Habitat,
Nevada,
This dataset describes the hydrogeomorphic structure and lake-tributary mixing in three intermediate-sized Lake Michigan rivermouths: Ford River, Manitowoc River, and Pere Marquette River. Data were collected from May to October 2011. Water chemistry variables were measured with a multiparameter sonde along longitudinal, lateral, and vertical transects. Magnesium, boron, and stable water isotope concentrations were also determined from grab water samples at particular depths.
This map shows the channel boundary (2011) of the Colorado River mainstem between the Utah Colorado border and the upper pool of Lake Powell, Utah (146 miles). The channel boundary was mapped from public available NAIP imagery flown on June 28, 2011, when the river flow was 886 m3/s at the Cisco gage. The channel is subdivided into channel types: fast water (main channel, secondary channel), and still water types (backwater, isolated pool and tributary channel).
Categories: Data;
Types: Citation,
Downloadable,
Map Service,
OGC WFS Layer,
OGC WMS Layer,
Shapefile;
Tags: Arches National Park,
Canyonlands National Park,
Colorado River,
Grand County,
Moab,
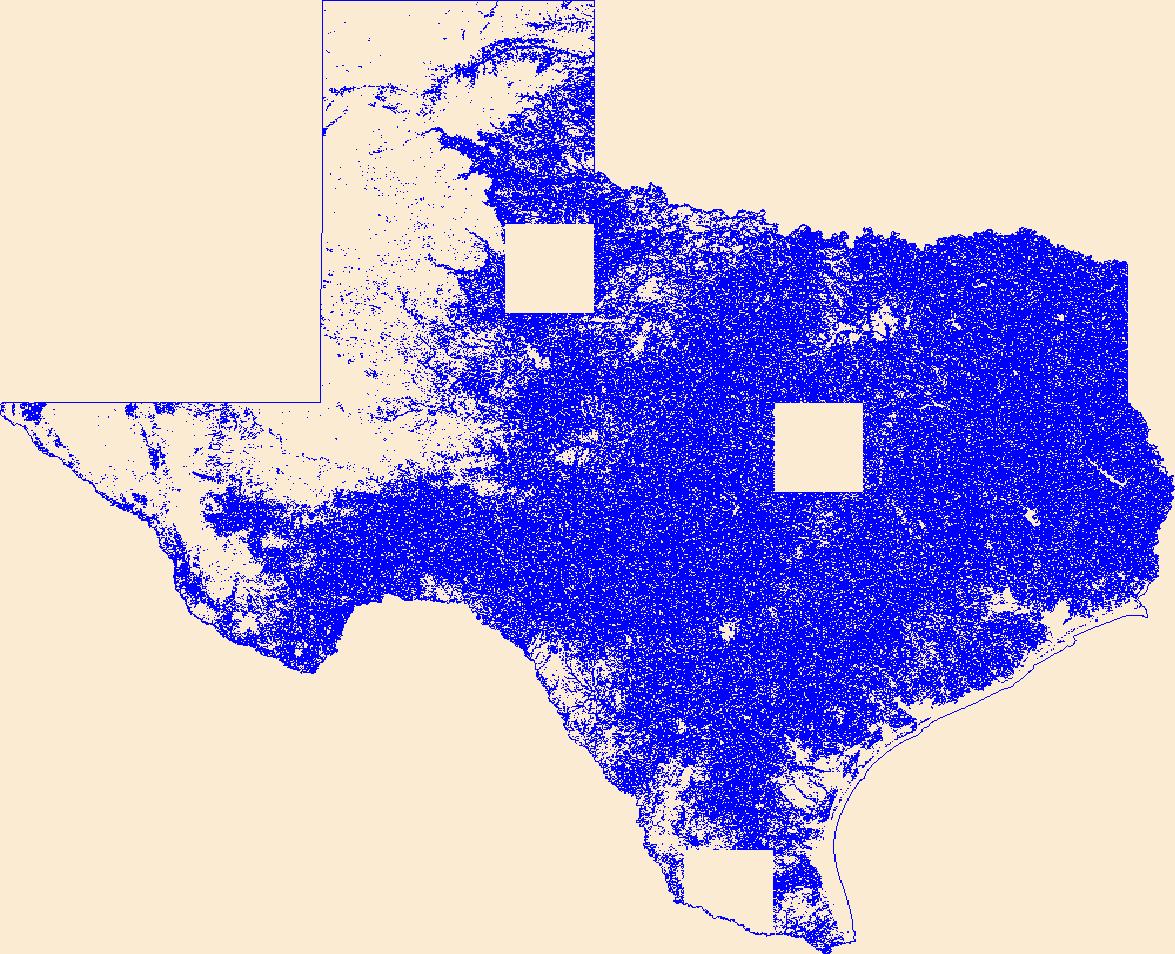
Geospatial data that is a derivative land cover product depicting woodland on topographic maps.
The U.S. Geological Survey (USGS), in cooperation with the U.S. Army Corps of Engineers (USACE), conducted a study from June 2014 through November 2014 to identify the hydrologic, chemical and microbiologic processes affecting declining pump performance and frequent pump failure at a confined disposal facility (CDF) in East Chicago, Indiana. Solid phase samples were collected from monitoring and extraction wells from September to November 2014. Qualitative and quantitative x-ray diffraction (XRD) analyses were done on eight samples of pump scrapings collected from five extraction wells (EW-4C, EW-4D, EW-11D, EW-20D) and one monitoring well (MW-4B). The data set includes a comma-separated value (.csv) file of XRD...
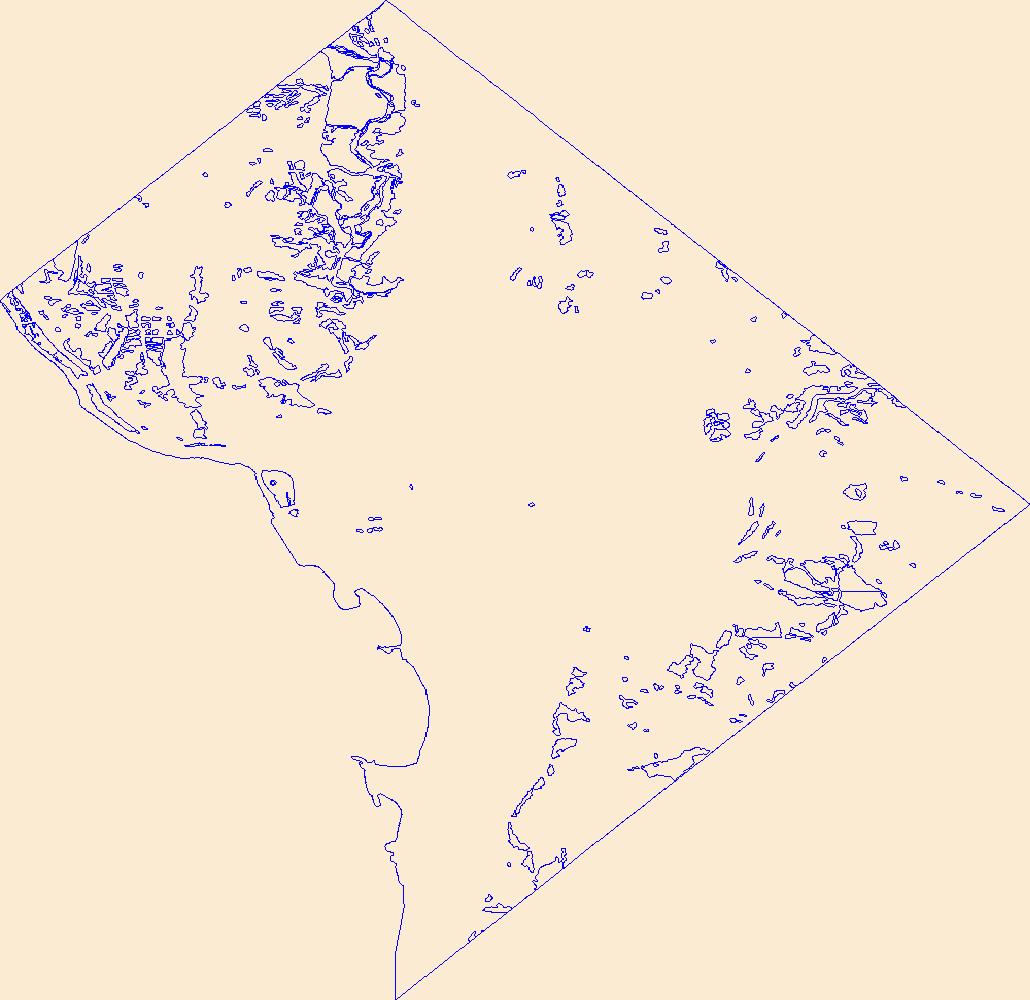
Geospatial data that is a derivative land cover product depicting woodland on topographic maps.
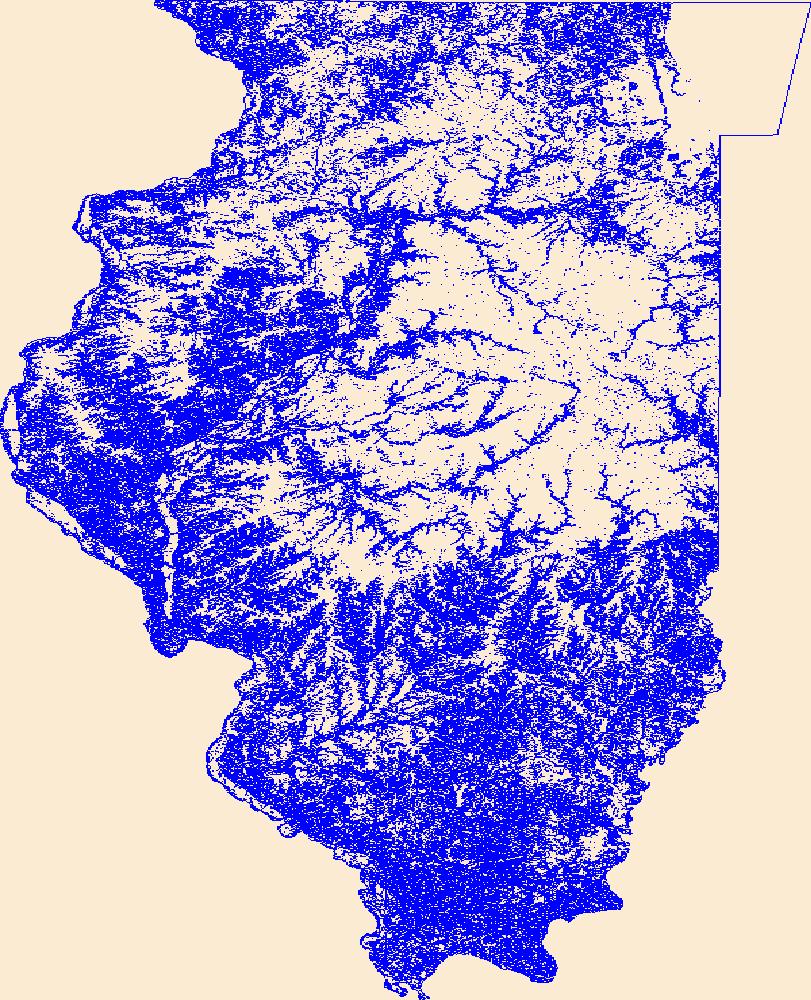
Geospatial data that is a derivative land cover product depicting woodland on topographic maps.
|

|
