Filters: Tags: hydrology (X) > partyWithName: U.S. Geological Survey (X)
773 results (45ms)|
Filters
Date Range
Extensions
Types Contacts
Categories
Tag Types
|
These are the data sets in machine readable files from a quantitative dye tracer test conducted at Langle Spring November 13-December 2, 2017 as part of the USGS training class, GW2227 Advanced Field Methods in Karst Terrains, held at the Savoy Experimental Watershed, Savoy Arkansas. Langle Spring is NWIS site 71948218, latitude 36.11896886, longitude -94.34548871. One pound of RhodamineWT dye was injected into a sinking stream at latitude 36.116772 longitude -94.341883 NAD83 on November 13, 2017 at 22:50. The data sets include original fluorimeter data logger files from Langle and Copperhead Springs, Laboratory Sectra-fluorometer files from standards and grab samples, and processed input and output files from the...
Water-quality data for groundwater samples collected from 4,824 sites between 1991 through 2018, and ancillary data and information on sampled wells and principal aquifers, were used to assess the occurrence and distribution of strontium in U.S. groundwater from 32 principal aquifers. This data release includes one tab-delimited text file detailing these data. Table: Chemical data from the U.S. Geological Survey National Water Information System and ancillary data considered for assessment of strontium concentration in U.S. groundwater.
Categories: Data;
Types: Map Service,
OGC WFS Layer,
OGC WMS Layer,
OGC WMS Service;
Tags: Hydrology,
NAWQA,
USGS Science Data Catalog (SDC),
Water Quality,
cycle 3,
The hydrologic response units (HRUs) available here were used in the Precipitation Runoff Modeling System (PRMS) of southern Guam documented by Rosa and Hay (2017). A Geographic Information System (GIS) file for the HRUs is provided as a shapefile with attributes ParentHRU, Region, and RegionHRU identifying the numbering convention used in the PRMS_2016 southern Guam model parameter files and Rosa and Hay (2017) report. Hydrologic response units (HRUs) were delineating using the processing steps outlined in Viger and Leavesley (2007) and a 5-meter digital elevation model (DEM) derived by Johnson (2012) using the Joint Airborne LIDAR Bathymetry Technical Center of Expertise topobathy data (National Oceanic and Atmospheric...
Categories: Data;
Types: Downloadable,
Map Service,
OGC WFS Layer,
OGC WMS Layer,
Shapefile;
Tags: Guam,
hydrology,
mathematical modeling
These data were released prior to the October 1, 2016 effective date for the USGS’s policy dictating the review, approval, and release of scientific data as referenced in USGS Survey Manual Chapter 502.8 Fundamental Science Practices: Review and Approval of Scientific Data for Release. The U.S. Geological Survey developed this dataset as part of the Colorado Front Range Infrastructure Resources Project (FRIRP). One goal of the FRIRP was to provide information on the availability of those hydrogeologic resources that are either critical to maintaining infrastructure along the northern Front Range or that may become less available because of urban expansion in the northern Front Range. This dataset extends from the...

These data were released prior to the October 1, 2016 effective date for the USGS’s policy dictating the review, approval, and release of scientific data as referenced in USGS Survey Manual Chapter 502.8 Fundamental Science Practices: Review and Approval of Scientific Data for Release. This data set represents potentiometric surface contours for the Minnekahta aquifer, Black Hills, South Dakota.

These data were released prior to the October 1, 2016 effective date for the USGS’s policy dictating the review, approval, and release of scientific data as referenced in USGS Survey Manual Chapter 502.8 Fundamental Science Practices: Review and Approval of Scientific Data for Release. This digital data set defines the altitudes of the tops of 16 model layers simulated in the Death Valley regional ground-water flow system (DVRFS) transient flow model. The area simulated by the DVRFS transient ground-water flow model is an approximately 45,000 square-kilometer region of southern Nevada and California. The thickness of model layers is derived by sequentially subtracting the altitudes of the uppermost to the lowermost...

These data were released prior to the October 1, 2016 effective date for the USGS’s policy dictating the review, approval, and release of scientific data as referenced in USGS Survey Manual Chapter 502.8 Fundamental Science Practices: Review and Approval of Scientific Data for Release. This digital dataset defines the spring 1961 water-table altitude for the California's Central Valley. It was used to initiate the water-level altitudes for the upper zones of the transient hydrologic model of the Central Valley flow system. The Central Valley encompasses an approximate 50,000 square-kilometer region of California. The complex hydrologic system of the Central Valley is simulated using the USGS numerical modeling...

These data were released prior to the October 1, 2016 effective date for the USGS’s policy dictating the review, approval, and release of scientific data as referenced in USGS Survey Manual Chapter 502.8 Fundamental Science Practices: Review and Approval of Scientific Data for Release. This digital data set defines the boundary of the area contributing ground-water flow to the Death Valley regional ground-water flow-system (DVRFS) model domain. The boundary encompasses an approximate 112,000 square-kilometer region and was based on a map of regional potential developed by Bedinger and Harrill (2004). Where possible, the amount of lateral flow across the segments of the DVRFS model boundary from (or to) the contributing...

These data were released prior to the October 1, 2016 effective date for the USGS’s policy dictating the review, approval, and release of scientific data as referenced in USGS Survey Manual Chapter 502.8 Fundamental Science Practices: Review and Approval of Scientific Data for Release. Recharge in the Death Valley regional ground-water flow system (DVRFS) was estimated from net infiltration simulated by Hevesi and others (2003) using a deterministic mass-balance method. Hevesi and others (2003) estimated potential recharge for the DVRFS, an approximately 100,000 square- kilometer region of southern Nevada and California, using the net-infiltration model, INFILv3. Net infiltration, estimated on a cell-by-cell basis,...

These data were released prior to the October 1, 2016 effective date for the USGS’s policy dictating the review, approval, and release of scientific data as referenced in USGS Survey Manual Chapter 502.8 Fundamental Science Practices: Review and Approval of Scientific Data for Release. Recharge in the Death Valley regional ground-water flow system (DVRFS) was estimated from net infiltration simulated by Hevesi and others (2003) using a deterministic mass-balance method. Hevesi and others (2003) estimated potential recharge for the DVRFS, an approximately 100,000 square-kilometer region of southern Nevada and California, using the net-infiltration model, INFILv3. Net infiltration, estimated on a cell-by-cell basis,...

These data were released prior to the October 1, 2016 effective date for the USGS’s policy dictating the review, approval, and release of scientific data as referenced in USGS Survey Manual Chapter 502.8 Fundamental Science Practices: Review and Approval of Scientific Data for Release. This digital dataset defines the depth of the Corcoran Clay Member of the Tulare Formation. The complex hydrologic system of the Central Valley is simulated using the USGS numerical modeling code MODFLOW-FMP (Schmid and others, 2006b). This simulation is referred to here as the Central Valley Hydrologic Model (CVHM) (Faunt, 2009). Utilizing MODFLOW-FMP, the CVHM simulates groundwater and surface-water flow, irrigated agriculture,...

These data were released prior to the October 1, 2016 effective date for the USGS’s policy dictating the review, approval, and release of scientific data as referenced in USGS Survey Manual Chapter 502.8 Fundamental Science Practices: Review and Approval of Scientific Data for Release. This digital dataset defines the model grid and altitudes of the top of the 10 model layers and base of the model simulated in the transient hydrologic model of the Central Valley flow system. The Central Valley encompasses an approximate 50,000 square-kilometer region of California. The complex hydrologic system of the Central Valley is simulated using the USGS numerical modeling code MODFLOW-FMP (Schmid and others, 2006), which...

These data were released prior to the October 1, 2016 effective date for the USGS’s policy dictating the review, approval, and release of scientific data as referenced in USGS Survey Manual Chapter 502.8 Fundamental Science Practices: Review and Approval of Scientific Data for Release. This digital dataset contains the surface-water network for the Central Valley Hydrologic Model (CVHM). The Central Valley encompasses an approximate 50,000-square-kilometer region of California. The complex hydrologic system of the Central Valley is simulated using the USGS numerical modeling code MODFLOW-FMP (Schmid and others, 2006). This simulation is referred to here as the CVHM (Faunt, 2009). Utilizing MODFLOW-FMP, the CVHM...
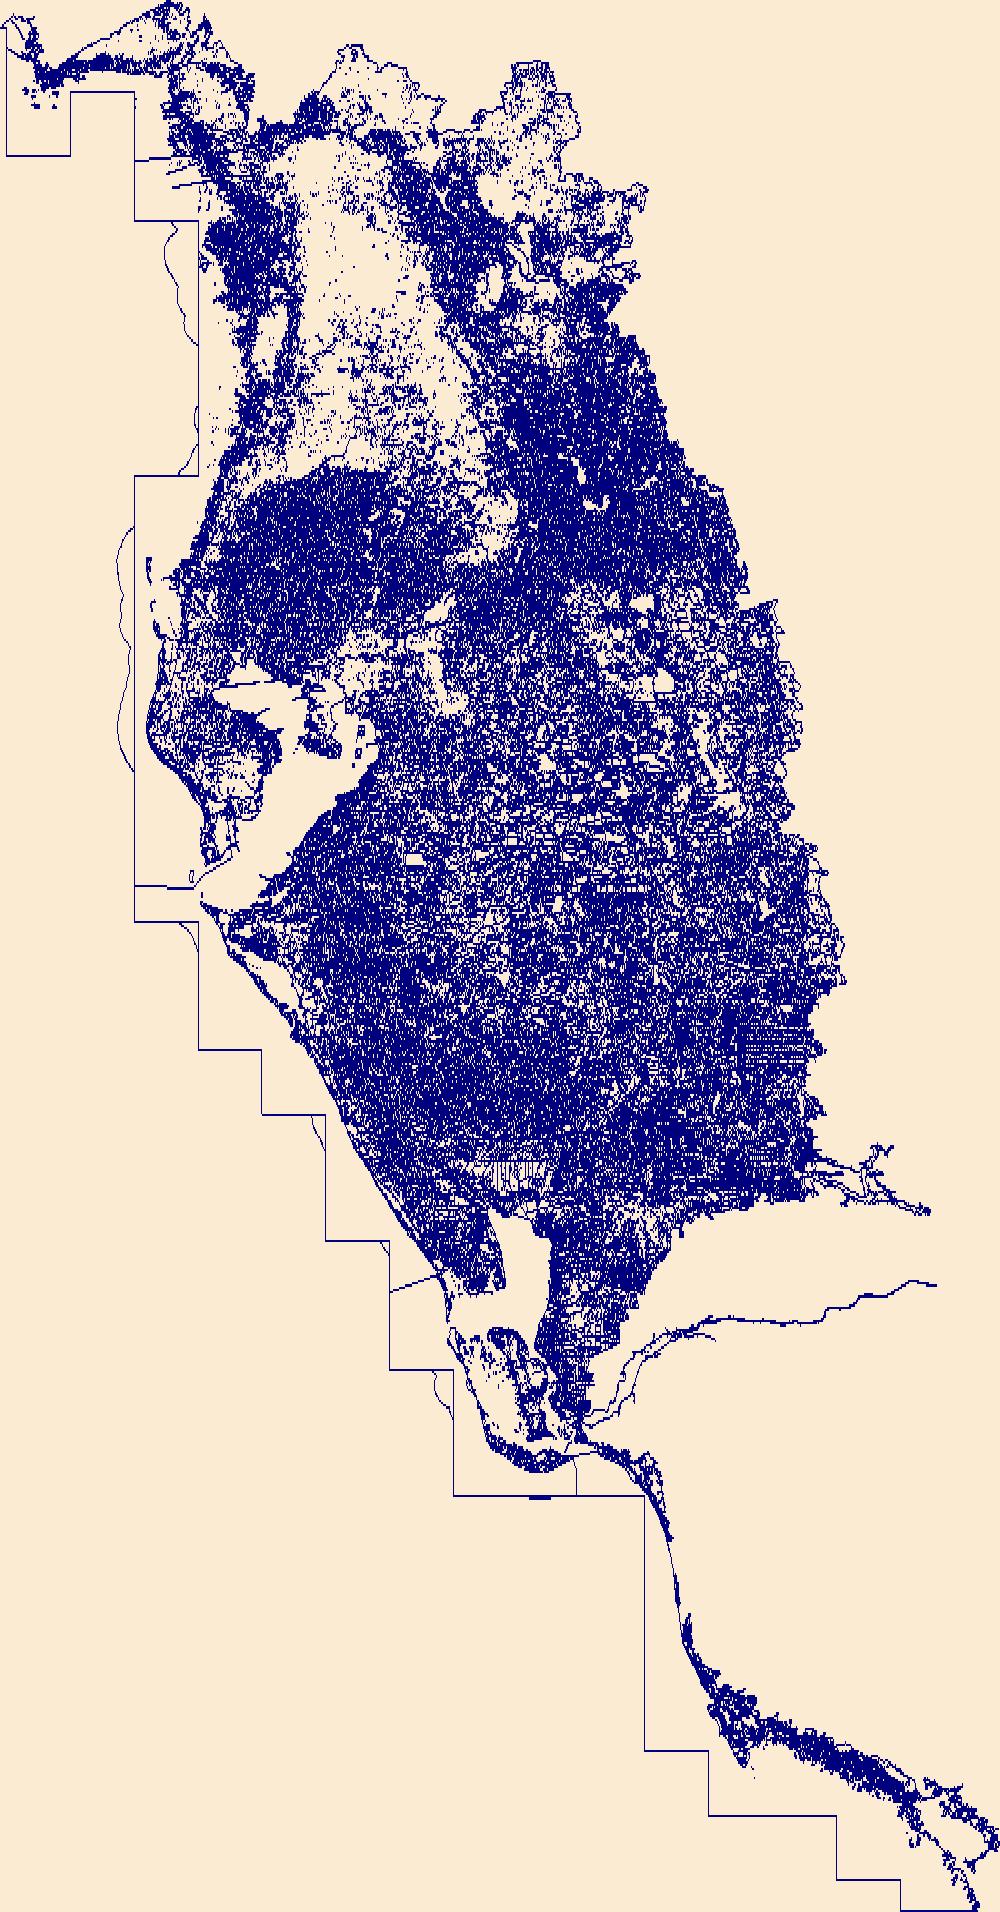
This dataset contains all the layers associated with U.S. Geological Survey (USGS) Great Lakes Coastal Wetland Restoration Assessment (GLCWRA) initiative for the Upper Peninsula Restoration Assessment (UPRA) which aims to identify and rank coastal areas with the greatest potential for wetland habitat restoration. Each layer has a unique contribution to the identification of restorable wetlands. The 7 parameters (Parameter 0: Mask, Parameter 1: Hydroperiod, Parameter 2: Wetland Soils, Parameter 3: Flowlines, Parameter 4: Conservation and Recreation Lands, Parameter 5: Impervious Surfaces, and Parameter 6: Land Use) and Index Composite directly correlate to areas that are recommended for restoration. The dikes, degree...
Categories: Data Release - Revised;
Types: GeoTIFF,
Map Service,
OGC WFS Layer,
OGC WMS Layer,
OGC WMS Service;
Tags: Chippewa,
Great Lakes,
Holocene,
Lake Huron,
Lake Michigan,
The U.S. Geological Survey (USGS) developed a systematic, quantitative approach to prioritize candidate basins that can support the assessment and forecasting objectives of the major USGS water science programs. Candidate basins were the level-4 hydrologic units (HUC4) with some of the smaller HUC4s being combined (hereafter referred to as modified HUC4 basins). Candidate basins for the contiguous United States (CONUS) were grouped into 18 hydrologic regions. Thirty-three geospatial variables representing land use, climate change, water use, water-balance components, streamflow alteration, fire risk, and ecosystem sensitivity were initially considered to assist in ranking candidate basins for study. The two highest...
Categories: Data;
Tags: Climatology,
Ecology,
Hydrology,
Integrated Water Science Basins,
Land Use Change,
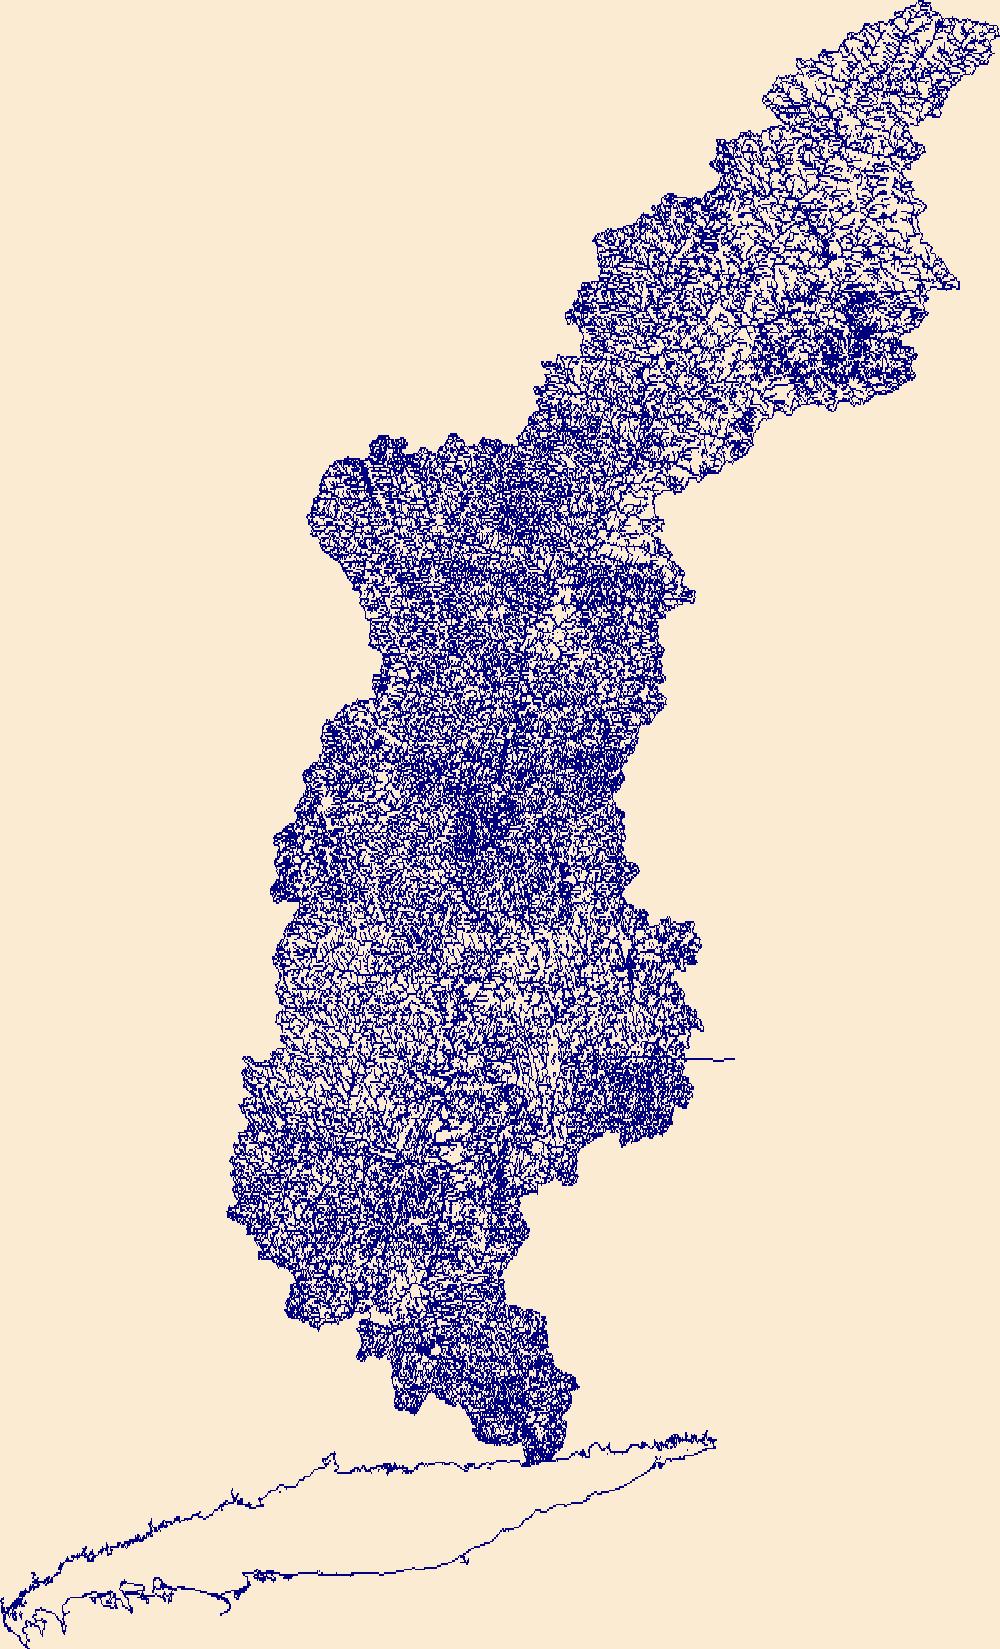
The High Resolution National Hydrography Dataset Plus (NHDPlus HR) is an integrated set of geospatial data layers, including the National Hydrography Dataset (NHD), National Watershed Boundary Dataset (WBD), and 3D Elevation Program Digital Elevation Model (3DEP DEM). The NHDPlus HR combines the NHD, 3DEP DEMs, and WBD to a data suite that includes the NHD stream network with linear referencing functionality, the WBD hydrologic units, elevation-derived catchment areas for each stream segment, "value added attributes" (VAAs), and other features that enhance hydrologic data analysis and routing.
The High Resolution National Hydrography Dataset Plus (NHDPlus HR) is an integrated set of geospatial data layers, including the best available National Hydrography Dataset (NHD), the 10-meter 3D Elevation Program Digital Elevation Model (3DEP DEM), and the National Watershed Boundary Dataset (WBD). The NHDPlus HR combines the NHD, 3DEP DEMs, and WBD to create a stream network with linear referencing, feature naming, "value added attributes" (VAAs), elevation-derived catchments, and other features for hydrologic data analysis. The stream network with linear referencing is a system of data relationships applied to hydrographic systems so that one stream reach "flows" into another and "events" can be tied to and traced...
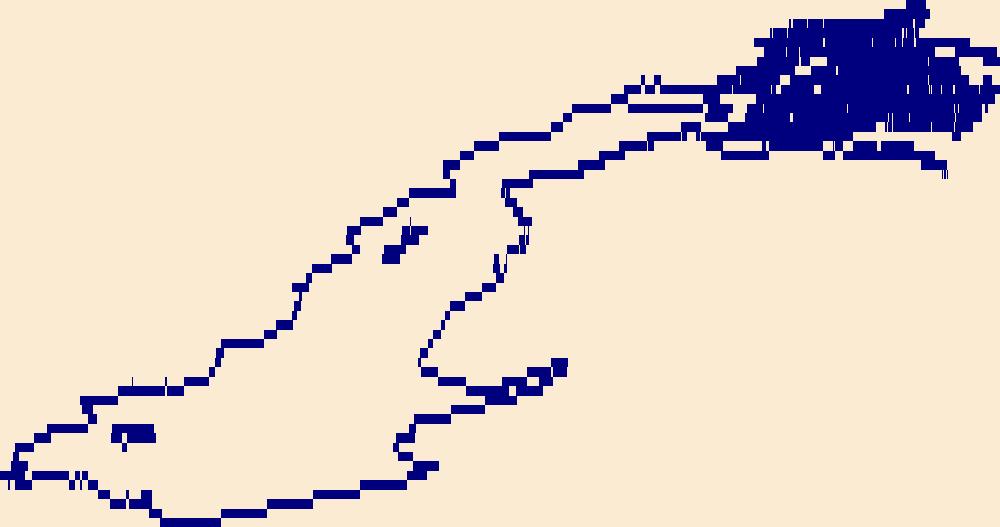
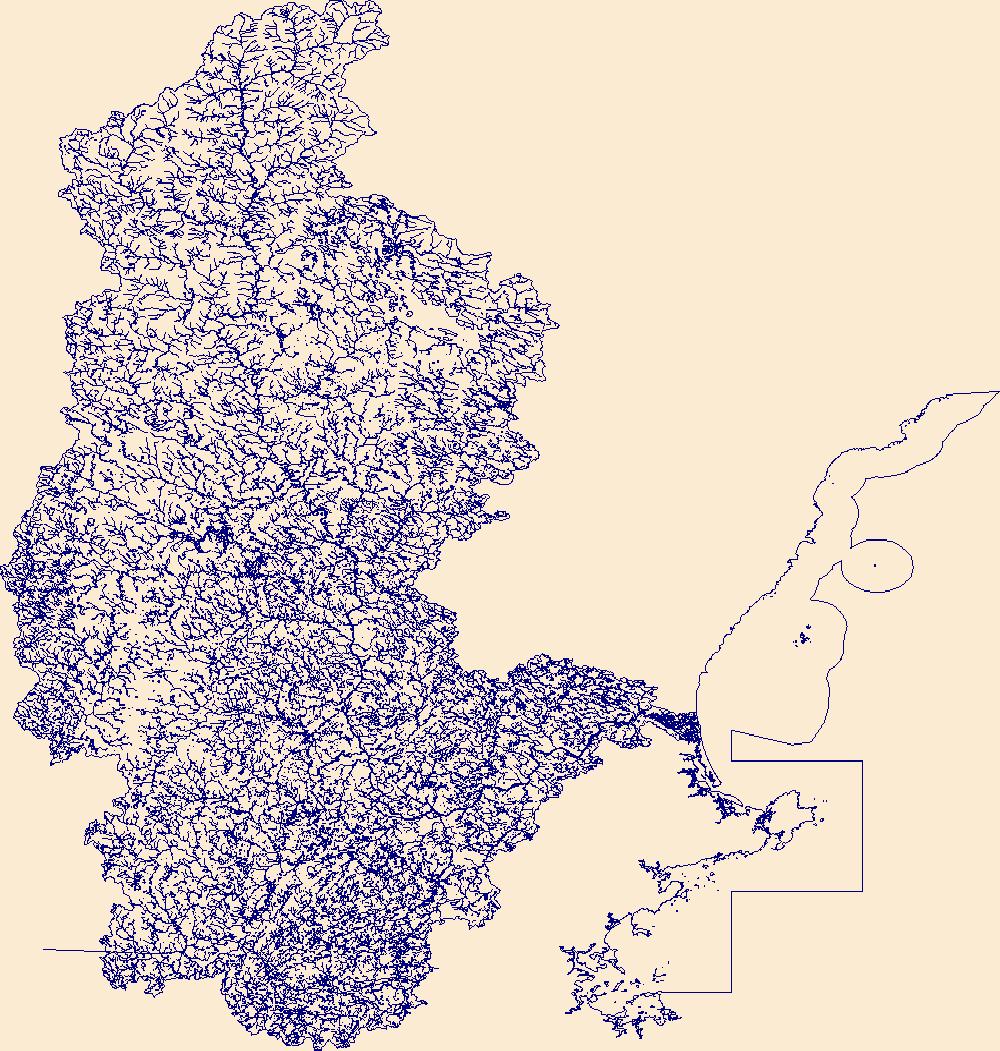
The High Resolution National Hydrography Dataset Plus (NHDPlus HR) is an integrated set of geospatial data layers, including the best available National Hydrography Dataset (NHD), the 10-meter 3D Elevation Program Digital Elevation Model (3DEP DEM), and the National Watershed Boundary Dataset (WBD). The NHDPlus HR combines the NHD, 3DEP DEMs, and WBD to create a stream network with linear referencing, feature naming, "value added attributes" (VAAs), elevation-derived catchments, and other features for hydrologic data analysis. The stream network with linear referencing is a system of data relationships applied to hydrographic systems so that one stream reach "flows" into another and "events" can be tied to and traced...
|

|
