Filters: Tags: inland waters (X)
589 results (11ms)|
Filters
Date Range
Extensions Types Contacts
Categories Tag Types
|
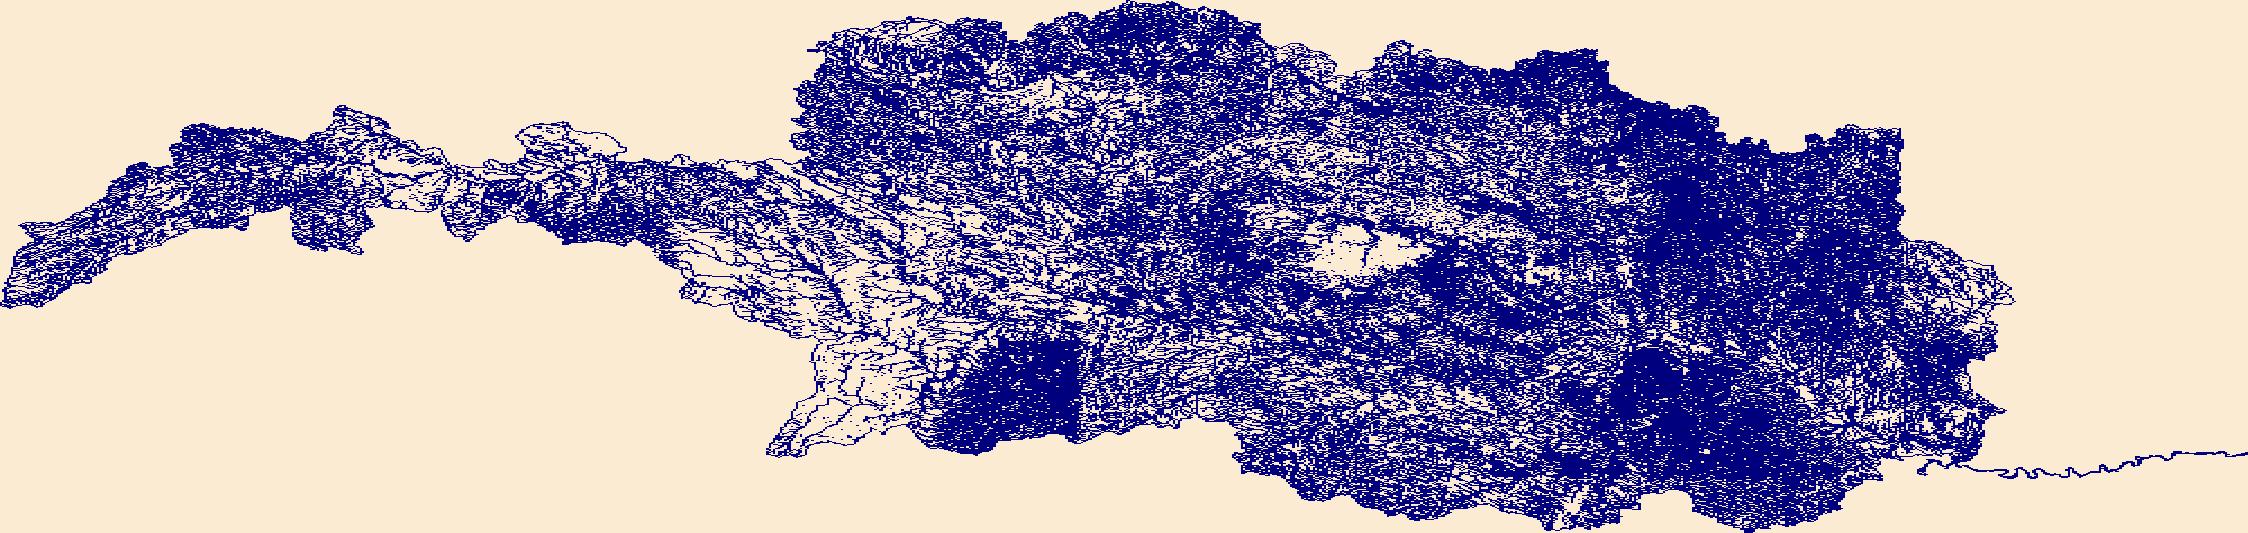
The High Resolution National Hydrography Dataset Plus (NHDPlus HR) is an integrated set of geospatial data layers, including the best available National Hydrography Dataset (NHD), the 10-meter 3D Elevation Program Digital Elevation Model (3DEP DEM), and the National Watershed Boundary Dataset (WBD). The NHDPlus HR combines the NHD, 3DEP DEMs, and WBD to create a stream network with linear referencing, feature naming, "value added attributes" (VAAs), elevation-derived catchments, and other features for hydrologic data analysis. The stream network with linear referencing is a system of data relationships applied to hydrographic systems so that one stream reach "flows" into another and "events" can be tied to and traced...

These geospatial data were collected during the July 13 and July 27, 2016 topographic and hydrographic survey of the Gallatin River at I-90 near Manhattan, MT.
These geospatial data were collected during the May 24, 2017 topographic and hydrographic survey of Saddle River in the vicinity of New Jersey State Route 17 at Ridgewood, NJ.
These geospatial data were collected during the August 30, 2016 topographic and hydrographic survey of the Wapsipinicon River in the vicinity of US-30 near near Wheatland, IA.
These geospatial data were collected during the August 30, 2016 topographic and hydrographic survey of the Upper Iowa River in the vicinity of IA-76 near Dorchester, IA.
These geospatial data were collected during the May 30-31, 2017 topographic and hydrographic survey of the Snake River at West River Road near Shelley, ID.
Assessing the distribution and abundance of both predator and prey (forage) fish species is a cornerstone of ecosystem-based fishery management, and supports decision making that considers food-web interactions. In support of binational Great Lakes fishery management the objectives of this survey were to: provide estimates of densities of key forage and predator species in the western basin of Lake Erie, to assess seasonal and spatial distributions of fishes in tandem with water quality information, and to assess year class strength. A systematic grid sampling approach with 41 stations was sampled via bottom trawl during June (Spring) and September (Autumn), starting in 2013. This data release adds 2021 data to...
Categories: Data;
Tags: Aquatic Biology,
Biota,
Bottom trawl survey,
Ecology,
Freshwater ecosystems,
Water-surface elevation measurements were collected in Spring, 2015 along the upper Willamette River, Oregon, between Harrisburg and Corvallis. These surveys were collected over a small range of discharges, from 6,900 cubic feet per second to 8,300 cubic feet per second, using a real-time kinematic global positioning system (RTK-GPS) on a motorboat at various cross sections along the river. These datasets were collected for equipment calibration and validation for the National Aeronautics and Space Administration’s (NASA) Surface Water and Ocean Topography (SWOT) satellite mission. This is one of multiple survey datasets that will be released for this effort.
Water-surface elevations were recorded by submerged pressure transducers in Spring, 2015 along the upper Willamette River, Oregon, between Eugene and Corvallis. The water-surface elevations were surveyed by using a real-time kinematic global positioning system (RTK-GPS) at each pressure sensor location. These water-surface elevations were logged over a small range of discharges, from 4,600 cubic feet per second to 10,800 cubic feet per second at Harrisburg, OR. These datasets were collected for equipment calibration and validation for the National Aeronautics and Space Administration’s (NASA) Surface Water and Ocean Topography (SWOT) satellite mission. This is one of multiple datasets that will be released for this...
The U.S. Geological Survey collected topographic data in cooperation with the U.S. Army Corps of Engineers to assist in the management of two recreation areas at Blue Mountain Lake and near Nimrod Lake in Arkansas. Data were collected March 3-4, 2020 using terrestrial light detection and ranging (T-lidar) surveying equipment, Global navigation Satellite System (GNSS) surveying equipment, and conventional surveying techniques. The surveyed locations had a parking area, boat ramp, and some small recreational structures. Each site was surveyed using a FARO 3D tripod-mounted T-lidar unit. Additionally, a topographic survey was conducted in order to georeference the lidar survey. These topographic data were collected...
These data are high-resolution bathymetry (riverbed elevation) and depth-averaged velocities in comma-delimited table format, generated from hydrographic and velocimetric surveys near highway bridge structures over the Missouri and Mississippi Rivers near St. Louis, Missouri, August 3–10, 2020. Hydrographic data were collected using a high-resolution multibeam echosounder mapping system (MBMS), which consists of a multibeam echosounder (MBES) and an inertial navigation system (INS) mounted on a marine survey vessel. Data were collected as the vessel traversed the river along planned survey lines distributed throughout the reach. Data collection software integrated and stored the depth data from the MBES and the...
Water surface elevations within seven Willamette River off-channel features (OCF; alcoves and side channels) were measured using submerged pressure transducers. Transducers were installed from late May through mid-October, 2016, when discharge of the Willamette River was between approximately 5,500 and 45,000 cubic feet per second at Salem, Oregon (USGS gage 14191000) and 3,500 to 17,500 cubic feet per second at Harrisburg, Oregon (USGS gage 14166000). Pressure transducer sensor depth was measured at all seven sites. For five of the sites, pressure transducer sensor depths were converted to water surface elevations by surveying the water surface at each transducer with a real-time kinematic global positioning system...
Categories: Data;
Types: Citation,
Map Service,
OGC WFS Layer,
OGC WMS Layer,
OGC WMS Service;
Tags: Ecology,
Geomorphology,
Oregon,
RTK,
USGS Science Data Catalog (SDC),
The basis for these features is U.S. Geological Survey Scientific Investigations Report 2016-5105 Flood-inundation maps for the Peckman River in the Townships of Verona, Cedar Grove, and Little Falls, and the Borough of Woodland Park, New Jersey, 2014.Digital flood-inundation maps for an approximate 7.5-mile reach of the Peckman River in New Jersey, which extends from Verona Lake Dam in the Township of Verona downstream through the Township of Cedar Grove and the Township of Little Falls to the confluence with the Passaic River in the Borough of Woodland Park, were created by the U.S. Geological Survey (USGS) in cooperation with the New Jersey Department of Environmental Protection. Flood profiles were simulated...
Types: Map Service,
OGC WFS Layer,
OGC WMS Layer,
OGC WMS Service;
Tags: Floods,
Hydrology,
Inland Waters,
Little Falls,
New Jersey,
These data are high-resolution bathymetry (riverbed elevation) and depth-averaged velocities in ASCII format, generated from hydrographic and velocimetric surveys of the Mississippi River near structure A5076 on Missouri State Highway 34 at Cape Girardeau, Missouri, in 2014 and 2018. Hydrographic data were collected using a high-resolution multibeam echosounder mapping system (MBMS), which consists of a multibeam echosounder (MBES) and an inertial navigation system (INS) mounted on a marine survey vessel. Data were collected as the vessel traversed the river along planned survey lines distributed throughout the reach. Data collection software integrated and stored the depth data from the MBES and the horizontal...
These data are high-resolution bathymetry (riverbed elevation) and depth-averaged velocities in ASCII format, generated from hydrographic and velocimetric surveys of the Mississippi River near structure A1700 on Interstate 155 near Caruthersville, Missouri, in 2008, 2011, 2014 and 2018. Hydrographic data were collected using a high-resolution multibeam echosounder mapping system (MBMS), which consists of a multibeam echosounder (MBES) and an inertial navigation system (INS) mounted on a marine survey vessel. Data were collected as the vessel traversed the river along planned survey lines distributed throughout the reach. Data collection software integrated and stored the depth data from the MBES and the horizontal...
These data are high-resolution bathymetry (riverbed elevation) and depth-averaged velocities in ASCII format, generated from hydrographic and velocimetric surveys of the Mississippi River near structure A5054 on Interstate 72 at Hannibal, Missouri, in 2014 and 2018. Hydrographic data were collected using a high-resolution multibeam echosounder mapping system (MBMS), which consists of a multibeam echosounder (MBES) and an inertial navigation system (INS) mounted on a marine survey vessel. Data were collected as the vessel traversed the river along planned survey lines distributed throughout the reach. Data collection software integrated and stored the depth data from the MBES and the horizontal and vertical position...
These data are high-resolution bathymetry (riverbed elevation) and depth-averaged velocities in ASCII format, generated from hydrographic and velocimetric surveys of the Missouri River near dual bridge structure A3665 on U.S. Highway 36 at St. Joseph, Missouri, in 2011, 2014, and 2018. Hydrographic data were collected using a high-resolution multibeam echosounder mapping system (MBMS), which consists of a multibeam echosounder (MBES) and an inertial navigation system (INS) mounted on a marine survey vessel. Data were collected as the vessel traversed the river along planned survey lines distributed throughout the reach. Data collection software integrated and stored the depth data from the MBES and the horizontal...
Natural cave passages penetrating a coastal aquifer in the Yucatan Peninsula (Mexico) were accessed to test the hypothesis that chemoclines associated with salinity gradients (haloclines) within the flooded cave networks of the karst subterranean estuary are sites of methane oxidation. Two field trips were carried out to the fully-submerged cave system located 6.6 km inland from the coastline in January 2015 and January 2016. Vertical chemical profiles across the water column haloclines were obtained using the OctoPiPi (OPP), a high-resolution water sampler built by the U.S. Geological Survey (USGS). The sampling efforts resulted in cm-scale profiles of major ions (e.g., chloride and sulfate), as well as concentrations...
These data are high-resolution bathymetry (riverbed elevation) and depth-averaged velocities in ASCII format, generated from hydrographic and velocimetric surveys of the Missouri River near Structure G0069 on Missouri State Highway 240 at Glasgow, Missouri, in 2011, 2013, and 2017. Hydrographic data were collected using a high-resolution multibeam echosounder mapping system (MBMS), which consists of a multibeam echosounder (MBES) and an inertial navigation system (INS) mounted on a marine survey vessel. Data were collected as the vessel traversed the river along planned survey lines distributed throughout the reach. Data collection software integrated and stored the depth data from the MBES and the horizontal and...
U.S. Geological Survey Rocky Mountain Region inland bathymetric survey data are compiled to create a survey inventory providing survey records including survey system and product information, and links to survey datasets when available. Dataset footprints including this information and showing the location and extent of surveys can be downloaded as a shapefile or geodatabase and can be accessed through Spatial Services provided here.
Categories: Data;
Types: ArcGIS REST Map Service,
ArcGIS Service Definition,
Downloadable,
Map Service;
Tags: Acoustic Sonar,
Bathymetry,
Coastal Zone,
Colorado,
Echo sounder,
|

|
