Filters: Tags: inland waters (X)
589 results (44ms)|
Filters
Date Range
Extensions Types Contacts
Categories Tag Types
|

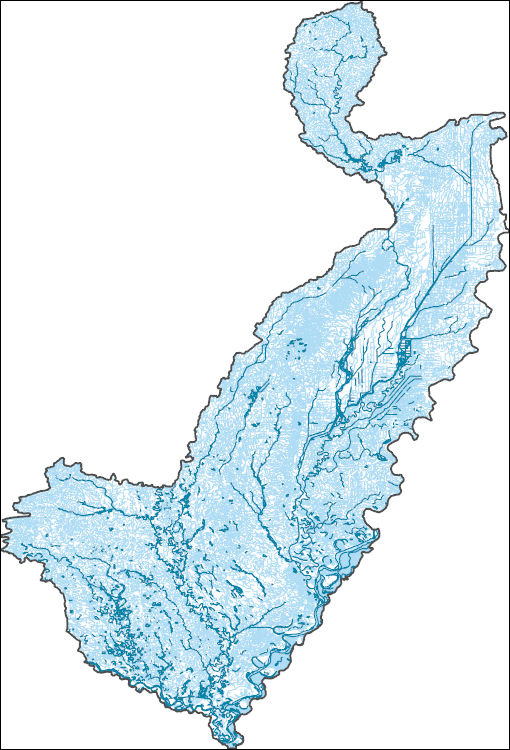
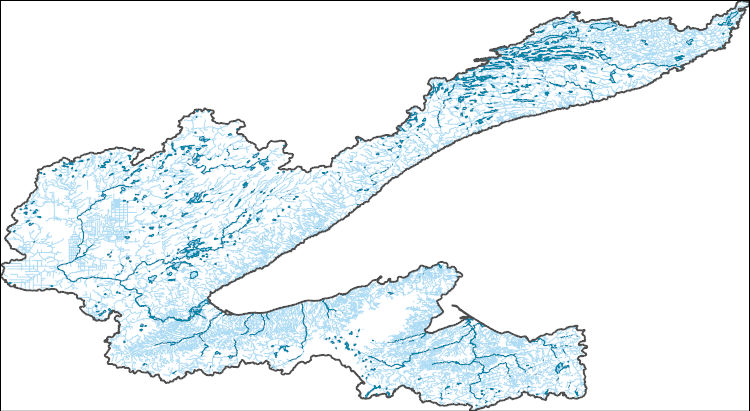
The High Resolution National Hydrography Dataset Plus (NHDPlus HR) is an integrated set of geospatial data layers, including the best available National Hydrography Dataset (NHD), the 10-meter 3D Elevation Program Digital Elevation Model (3DEP DEM), and the National Watershed Boundary Dataset (WBD). The NHDPlus HR combines the NHD, 3DEP DEMs, and WBD to create a stream network with linear referencing, feature naming, "value added attributes" (VAAs), elevation-derived catchments, and other features for hydrologic data analysis. The stream network with linear referencing is a system of data relationships applied to hydrographic systems so that one stream reach "flows" into another and "events" can be tied to and traced...

The High Resolution National Hydrography Dataset Plus (NHDPlus HR) is an integrated set of geospatial data layers, including the best available National Hydrography Dataset (NHD), the 10-meter 3D Elevation Program Digital Elevation Model (3DEP DEM), and the National Watershed Boundary Dataset (WBD). The NHDPlus HR combines the NHD, 3DEP DEMs, and WBD to create a stream network with linear referencing, feature naming, "value added attributes" (VAAs), elevation-derived catchments, and other features for hydrologic data analysis. The stream network with linear referencing is a system of data relationships applied to hydrographic systems so that one stream reach "flows" into another and "events" can be tied to and traced...

The High Resolution National Hydrography Dataset Plus (NHDPlus HR) is an integrated set of geospatial data layers, including the best available National Hydrography Dataset (NHD), the 10-meter 3D Elevation Program Digital Elevation Model (3DEP DEM), and the National Watershed Boundary Dataset (WBD). The NHDPlus HR combines the NHD, 3DEP DEMs, and WBD to create a stream network with linear referencing, feature naming, "value added attributes" (VAAs), elevation-derived catchments, and other features for hydrologic data analysis. The stream network with linear referencing is a system of data relationships applied to hydrographic systems so that one stream reach "flows" into another and "events" can be tied to and traced...
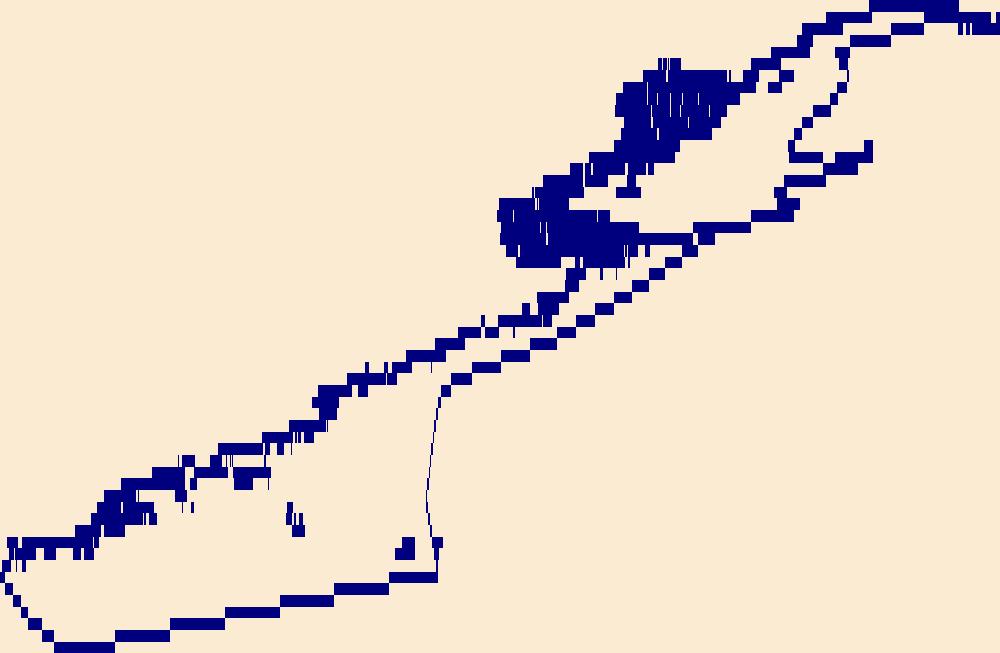
These data are high-resolution bathymetry (riverbed elevation) in ASCII XYZ format, generated from the July 16, 2011, hydrographic and velocimetric survey of the Missouri River near structure 435-105-11.97(235) on Interstate 435 in Kansas City, Missouri, during summer flooding on the Missouri River. Hydrographic data were collected using a high-resolution multibeam echosounder mapping system (MBMS), which consists of a multibeam echosounder (MBES) and an inertial navigation system (INS) mounted on a marine survey vessel. Data were collected as the vessel traversed the river along planned survey lines distributed throughout the reach. Data collection software integrated and stored the depth data from the MBES and...
These data are high-resolution bathymetry (riverbed elevation) in ASCII XYZ format, generated from the June 6, 2014, hydrographic and velocimetric survey of the Mississippi River near structure K0932 on U.S. Highway 54 at Louisiana, Missouri. Hydrographic data were collected using a high-resolution multibeam echosounder mapping system (MBMS), which consists of a multibeam echosounder (MBES) and an inertial navigation system (INS) mounted on a marine survey vessel. Data were collected as the vessel traversed the river along planned survey lines distributed throughout the reach. Data collection software integrated and stored the depth data from the MBES and the horizontal and vertical position and attitude data of...
Plant data were collected on 16, 1-ha experimental blocks in C3 and Marsh Creek units of Seney National Wildlife Refuge, 2006-2010. The percent cover of each plant taxon, moss as a group, and open area was recorded sing a modified line-intercept method for each of 25 sampling points within a block. Sampling points were equidistantly spaced, with 5 points spaced 25 m apart along each of 5 transects also spaced 25 m apart within each sampling block. Within each unit, we selected 4 pairs of blocks representing sedge-shrub habitat, with one of the pair assigned to spring burning (C3, May 2008) or summer burning (Marsh Creek, 2007 and 2008). This before-after-control-impact design provided for data collection two growing...
Categories: Data;
Tags: Michigan,
Schoolcraft County,
Seney National Wildlife Refuge,
aquatic plants,
biota,
River bathymetry and stream velocity measurements were collected in March 2015 along the upper Willamette River, Oregon, between Eugene and Corvallis. These surveys were collected over a small range of discharges using a real time kinematic global positioning system (RTK-GPS) and acoustic Doppler current profiler (ADCP) on a motorboat while transecting at various cross sections along the river. These datasets were collected for equipment calibration and validation for the National Aeronautics and Space Administration’s (NASA) Surface Water and Ocean Topography (SWOT) satellite mission. This is one of multiple survey datasets that will be released for this effort.
The basis for these features is U.S. Geological Survey Scientific Investigations Report 2016-5105 Flood-inundation maps for the Peckman River in the Townships of Verona, Cedar Grove, and Little Falls, and the Borough of Woodland Park, New Jersey, 2014.Digital flood-inundation maps for an approximate 7.5-mile reach of the Peckman River in New Jersey, which extends from Verona Lake Dam in the Township of Verona downstream through the Township of Cedar Grove and the Township of Little Falls to the confluence with the Passaic River in the Borough of Woodland Park, were created by the U.S. Geological Survey (USGS) in cooperation with the New Jersey Department of Environmental Protection. Flood profiles were simulated...
Types: Map Service,
OGC WFS Layer,
OGC WMS Layer,
OGC WMS Service;
Tags: Little Falls,
New Jersey,
Passaic River,
Peckman River,
Verona,
Continuous water-temperature data were collected at multiple sites along the Middle Fork and mainstem Willamette Rivers between Jasper and Newberg, Oregon, to support effectiveness monitoring for a large-scale channel and floodplain restoration program (Willamette Focused Investment Partnership, WFIP). Continuous water temperature loggers were deployed at a subset of WFIP restoration sites where river restoration activities were implemented to improve habitat conditions for native fish species. Data from water-temperature monitoring will be used to evaluate the effectiveness of restoration activities at improving habitat conditions for ESA-listed salmonids and other native fish in the Willamette River. Additionally,...
Inland water ecosystems dynamically process, transport, and sequester carbon. However, the transport of carbon through aquatic environments has not been quantitatively integrated in the context of terrestrial ecosystems. Here, we present the first integrated assessment, to our knowledge, of freshwater carbon fluxes for the conterminous United States, where 106 (range: 71–149) teragrams of carbon per year (TgC⋅y−1) is exported downstream or emitted to the atmosphere and sedimentation stores 21 (range: 9–65) TgC⋅y−1 in lakes and reservoirs. We show that there is significant regional variation in aquatic carbon flux, but verify that emission across stream and river surfaces represents the dominant flux at 69 (range:...
Categories: Publication;
Types: Journal Citation;
Tags: Aquatic carbon,
Carbon flux,
Conterminous United States,
Inland waters,
Terrestrial carbon
These data were compiled to accompany flow modeling work on Kanab Creek near the mouth (USGS gage 09403850). The data include topographic data collected by a remote sensing detection light detection and ranging (LIDAR) system and surveying total station in June 2017, high water marks from six floods from 2011 to 2013, and control points and gage structures. Topographic data include ground topography collected by LIDAR and channel bathymetry collected by total station survey of a 600 meter reach of Kanab Creek, ending at the confluence with the Colorado River in Grand Canyon, Arizona. High water mark data include sets from six floods collected by USGS personnel using total station surveys.
These data are high-resolution bathymetry (riverbed elevation) and depth-averaged velocities in ASCII format, generated from hydrographic and velocimetric surveys of the Missouri River near dual bridges structure A4557 on Missouri State Highway 370 near St. Louis, Missouri, in 2010, 2011, and 2016. Hydrographic data were collected using a high-resolution multibeam echosounder mapping system (MBMS), which consists of a multibeam echosounder (MBES) and an inertial navigation system (INS) mounted on a marine survey vessel. Data were collected as the vessel traversed the river along planned survey lines distributed throughout the reach. Data collection software integrated and stored the depth data from the MBES and...
These data are high-resolution bathymetry (riverbed elevation) and depth-averaged velocities in ASCII format, generated from hydrographic and velocimetric surveys of the Mississippi River near structures A4936/A1850 on Interstate 255 near St. Louis, Missouri, in 2008, 2009, 2010 and 2016. Hydrographic data were collected using a high-resolution multibeam echosounder mapping system (MBMS), which consists of a multibeam echosounder (MBES) and an inertial navigation system (INS) mounted on a marine survey vessel. Data were collected as the vessel traversed the river along planned survey lines distributed throughout the reach. Data collection software integrated and stored the depth data from the MBES and the horizontal...
These data are high-resolution bathymetry (riverbed elevation) in ASCII format, generated from hydrographic surveys near six highway bridge structures over the Gasconade River in central Missouri. These sites were surveyed in June 2017 to help identify possible effects from extreme flooding on May 1-2, 2017. At the five downstream sites, hydrographic data were collected using a high-resolution multibeam echosounder mapping system (MBMS), which consists of a multibeam echosounder (MBES) and an inertial navigation system (INS) mounted on a marine survey vessel. Data were collected as the vessel traversed the river along planned survey lines distributed throughout the reach. Data collection software integrated and...
Statistical analyses and maps representing mean, high, and low water-level conditions in the surface water and groundwater of Miami-Dade County were made by the U.S. Geological Survey, in cooperation with the Miami-Dade County Department of Regulatory and Economic Resources, to help inform decisions necessary for urban planning and development. Sixteen maps were created that show contours of (1) the mean of daily water levels at each site during October and May for the 2000-2009 water years; (2) the 25th, 50th, and 75th percentiles of the daily water levels at each site during October and May and for all months during 2000-2009; and (3) the differences between mean October and May water levels, as well as the differences...
Several anthropogenic CA datasets were used to evaluate potential water quality or physical habitat impacts to Aquatic Coarse-Filter CEs. The ADEC impaired waters dataset showed all streams and lakes that did not meet State Water Quality Standards approved by EPA as of 2010. There were seven impaired streams and no impaired lakes within the Central Yukon study area. Birch, Crooked, and Goldstream creeks were listed for turbidity due to placer mining activities. Garrison Slough was listed for PCBs from military activities. Chena River, Chena Slough, and Noyes Slough were listed for sedimentation in addition to other contaminants from urban runoff in Fairbanks. The total length of impaired streams in the Central Yukon...
The current (2015) and long-term future (2060) landscape condition model (LCM) was modified for Aquatic Coarse-Filter CEs to develop condition scores for both the stream network and individual 6th-level hydrologic units. Landscape condition is a measurement of the impact of the human footprint on a landscape. Human modifications were categorized into different levels of impact (site impact scores) based on the current state of knowledge about the impacts of specific human land uses. An artificial stream network was calculated from the USGS National Elevation Dataset 2 Arc Second Digital Elevation Model using TauDEM. The flow direction grid and LCM grids were used to create a condition-weighted contributing area...
Thawing permafrost in interior Alaska will lead to dramatic changes in stream discharge, bank stability, and water chemistry. Stream discharge will change from surface- to groundwater-dominated flow, resulting in increased baseflows (including winter flows) and declining annual flows. Thawing permafrost along streams and rivers will decrease bank stability, which could lead to erosion and alteration of the stream channel. Shifts to deeper flow paths will result in altered stream chemistry, depending upon the soil types intersected and residence times. Observations in Alaska show that flow paths will interact with organic-rich soils and result in increased concentrations of dissolved organic carbon and nitrogen,...
Deep connected lakes are lakes that are generally greater than 1.6m depth and are hydrologically connected to flowlines. They are characterized by low temperatures, low prey densities, short open water periods, and limited overwintering habitat. Because of their depth and perennial flow, it is less likely that deep connected lakes freeze completely during winter, therefore providing important winter refuge for fish and other aquatic organisms. All lakes connected to flow lines were extracted from the USGS National Hydrography Dataset (NHD) on the North Slope, and lakes with depth greater than 1.6m were identified as deep connected lakes. This dataset provides the basis for the analysis of deep connected lakes as...
Some of the NOS rasters intentionally do not align or have the same extent. These rasters were not snapped to a common raster per the authors' discretion. Please review selected rasters prior to use. These varying alignments are a result of the use of differing source data sets and all products derived from them. We recommend that users snap or align rasters as best suits their own projects. - Construction or development, especially oil and gas operations near deep connected lakes could increase sedimentation to lakes. Run-off from unpaved roads can result in sedimentation to lakes increasing turbidity and impacting water quality for aquatic organisms and human use. Oil and gas activities near streams that are connected...
|

|