Filters: Tags: inlandWaters (X) > Date Range: {"choice":"month"} (X)
99 results (176ms)|
Filters
Date Types (for Date Range)
Types Contacts
Categories
Tag Types
|
These data were compiled for/to modeling efforts for U.S. Bureau of Reclamation National Environmental Policy Act (NEPA) analyses for the Colorado River in Grand Canyon, Arizona. Objective(s) of our study were to create revised monthly Lake Powell elevations and outflows from Bureau of Reclamation Colorado River Mid-term Modeling System (CRMMS) traces that incorporate the alternatives in the sEIS documents and indicate when potential actions may occur and how that changes water movement and storage. These data represent monthly hydrologies for Lake Powell: inflow, outflow, and elevation forecasts for 2024-2027, as well as volumes of water in outflows for different water mangement strategies in NEPA supplemental...

The High Resolution National Hydrography Dataset Plus (NHDPlus HR) is an integrated set of geospatial data layers, including the National Hydrography Dataset (NHD), National Watershed Boundary Dataset (WBD), and 3D Elevation Program Digital Elevation Model (3DEP DEM). The NHDPlus HR combines the NHD, 3DEP DEMs, and WBD to a data suite that includes the NHD stream network with linear referencing functionality, the WBD hydrologic units, elevation-derived catchment areas for each stream segment, "value added attributes" (VAAs), and other features that enhance hydrologic data analysis and routing.

The High Resolution National Hydrography Dataset Plus (NHDPlus HR) is an integrated set of geospatial data layers, including the National Hydrography Dataset (NHD), National Watershed Boundary Dataset (WBD), and 3D Elevation Program Digital Elevation Model (3DEP DEM). The NHDPlus HR combines the NHD, 3DEP DEMs, and WBD to a data suite that includes the NHD stream network with linear referencing functionality, the WBD hydrologic units, elevation-derived catchment areas for each stream segment, "value added attributes" (VAAs), and other features that enhance hydrologic data analysis and routing.
This data release contains time series and plots summarizing mean monthly temperature and total monthly precipitation, runoff, and streamflow from the U.S. Geological Survey Monthly Water Balance Model at 115 National Wildlife Refuges within the U.S. Fish and Wildlife Service Mountain-Prairie Region (CO, KS, MT, NE, ND, SD, UT, and WY). The four variables are derived from two sets of statistically-downscaled general circulation models from 1951 through 2099. The three variables were summarized for comparison across four 19-year periods: historic (1951-1969), baseline (1981-1999), 2050 (2041-2059), and 2080 (2071-2089). For each refuge, mean monthly plots, seasonal box plots, and annual envelope plots were produced...
This data release contains time series and plots summarizing mean monthly temperature and total monthly precipitation, and runoff from the U.S. Geological Survey Monthly Water Balance Model at 115 National Wildlife Refuges within the U.S. Fish and Wildlife Service Mountain-Prairie Region (CO, KS, MT, NE, ND, SD, UT, and WY). The three variables are derived from two sets of statistically-downscaled general circulation models from 1951 through 2099. The three variables were summarized for comparison across four 19-year periods: historic (1951-1969), baseline (1981-1999), 2050 (2041-2059), and 2080 (2071-2089). For each refuge, mean monthly plots, seasonal box plots, and annual envelope plots were produced for each...
Categories: Data;
Types: Downloadable,
Map Service,
OGC WFS Layer,
OGC WMS Layer,
Shapefile;
Tags: Climatology,
Colorado,
Hydrology,
Kansas,
Montana,
These data are high-resolution bathymetry (riverbed elevation) in compressed LAS (*.laz) format, generated from the July 17–19, 2023, hydrographic survey of Bubbly Creek and various sidings, harbors, and turning basins on the Chicago Sanitary and Ship Canal (CS&SC) in Cook County, Illinois. The survey includes all Bubbly Creek from the confluence with the CS&SC in the north to the Racine Avenue Pump station in the south; various sidings and turning basins along the CS&SC between Kedzie Avenue and South Halsted Street; and the Marine Safety Station harbor near the Chicago Harbor Lock on Lake Michigan. This survey is a continuation and enhancement of the bathymetric survey of the CS&SC in Cook County, Illinois, conducted...
This data release contains monthly 270-meter resolution Basin Characterization Model (BCMv8) climate and hydrologic variables for Localized Constructed Analog (LOCA; Pierce et al., 2014)-downscaled Global Climate Models (GCMs) for Representative Concentration Pathway (RCP) 4.5 (medium-low emissions) and 8.5 (high emissions) for hydrologic California. The 20 future climate scenarios consist of ten GCMs with RCP 4.5 and 8.5 each: ACCESS 1.0, CanESM2, CCSM4, CESM1-BGC, CMCC-CMS, CNRM-CM5, GFDL-CM3, HadGEM2-CC, HadGEM2-ES, and MIROC5. The LOCA climate scenarios span water years 1950 to 2099 with greenhouse-gas forcings beginning in 2006. The LOCA downscaling method has been shown to produce better estimates of extreme...
Continuous water temperature data were collected at multiple sites along the Middle Fork and mainstem Willamette Rivers between Jasper and Newberg, Oregon, to support effectiveness monitoring for a large-scale channel and floodplain restoration program (Willamette Focused Investment Partnership, WFIP). Continuous water temperature loggers were deployed at a subset of WFIP restoration sites where river restoration activities were implemented to improve habitat conditions for native fish species. Data from water temperature monitoring will be used to evaluate the effectiveness of restoration activities at improving habitat conditions for Endangered Species Act (ESA)-listed salmonids and other native fish in the Willamette...
Categories: Data;
Tags: Albany,
Bowers Rock State Park,
Browns Island,
Collins Bay,
Middle Fork Willamette River,
This data release contains site information and potential explanatory factor data for 1,899 groundwater sites. These sites were used to assess groundwater quality in aquifers used for domestic and public drinking water supply in the southeastern San Joaquin Valley. The southeastern San Joaquin Valley (SESJV) study unit consists of five study areas whose boundaries are defined by the eponymous California Department of Water Resources groundwater subbasins of the San Joaquin Valley groundwater basin: Madera-Chowchilla, Kings, Kaweah, Tule, and Tulare Lake. The sites consist of 198 wells representing the domestic-supply aquifer and 1,701 wells representing the public-supply aquifer. The domestic-supply aquifer wells...
This data release provides model inputs and outputs for a model that predicts redox conditions in groundwater in the contiguous United States. Input variables describe the hydrology, soils, geology, and hydrologic position of groundwater sample locations. The data release accompanies a journal article that describes model development and applications (Tesoriero_and_others_2023).
Categories: Data;
Tags: Hydrology,
USGS Science Data Catalog (SDC),
United States,
environment,
groundwater,
This dataset represents 505 campsites along the Colorado River in Grand Canyon with associated debris flow probabilities calculated for approximately a 100-year period (Griffiths and others, 2004) and geomorphic attributes mapped by the U.S. Geological Survey, Grand Canyon Monitoring and Research Center (USGS-GCMRC) (Hadley and others, 2018). The campsite polygons were developed as part of a master campsite database that was a collaborative effort to maintain between the National Park Service in Grand Canyon National Park and the USGS-GCMRC. Debris flow probabilities have been added as an attribute from ungauged tributary watersheds published in 2004 (Griffiths and others, 2004). Area and percentages of campsites...
Categories: Data,
Data Release - In Progress,
Data Release - Provisional;
Types: Downloadable,
Map Service,
OGC WFS Layer,
OGC WMS Layer,
Shapefile;
Tags: Arizona,
Colorado River,
Glen Canyon,
Glen Canyon National Recreation Area,
Grand Canyon,
The dataset contains data collected with an acoustic Doppler current profiler (ADCP) for a reach of the Missouri River at Sheepnose Bend downstream from Lexington, Missouri. Velocity data was collected using a TeleDyne Marine RD Instruments (Poway, California) Rio Grande Workhorse 600 kilohertz ADCP on June 4, 2020. Positioning used a Trimble Real-Time-Kinematic Global Navigation Satellite System. This data release consists of one shapefile with depth-averaged velocity magnitude and direction data and 40 text files that contain processed ascii velocity data exported from WinRIver II, Teledyne Marine RD Insturments (Poway, California) ADCP software.
This U.S. Geological Survey (USGS) metadata release consists of 17 different spatial layers in GeoTIFF format. They are: 1) average water capacity (AWC.zip), 2) percent sand (Sand.zip), 3) percent silt (Silt.zip), 4) percent clay (Clay.zip), 5) soil texture (TEXT_PRMS.zip), 6) land use/land cover (LULC.zip), 7) snow values (Snow.zip), 8) summer rain values (SRain.zip), 9) winter rain values (WRain.zip), 10) leaf presence values (keep.zip), 11) leaf loss values (loss.zip), 12) percent tree canopy (CNPY.zip), 13) percent impervious surface (Imperv.zip), 14) snow depletion curve numbers (Snow.zip), 15) rooting depth (RootDepth.zip), 16) permeability values (Lithology_exp_Konly_Project.zip), and 17) water bodies. All...
Categories: Data;
Tags: Canada,
average water capacity,
boundaries,
conterminous United States of America,
geographic information systems (GIS),
Daily maximum water temperature predictions in the Delaware River Basin (DRB) can inform decision makers who can use cold-water reservoir releases to maintain thermal habitat for sensitive fish species. This data release contains the forcings and outputs of 7-day ahead maximum water temperature forecasting models that makes predictions at 70 river reaches in the upper DRB. The modeling approach includes process-guided deep learning and data assimilation (Zwart et al., 2023). The model is driven by weather forecasts and observed reservoir releases and produces maximum water temperature forecasts for the issue day (day 0) and 7 days into the future (days 1-7). In combination with data provided in Oliver et al. (2022),...
This metadata record documents a set of 118 comma delimited files and a data dictionary describing the inputs for the U.S. Geological Survey Precipitation Runoff Modeling System (PRMS) which is used to drive the National Hydrologic Model (NHM) for the United States-Canada transboundary domain. The National Hydrologic Model database contains parameters for hydrologic response units (HRUs) and stream segments needed to run the NHM. These parameters are generated using python scripts to process input datasets such as digital elevation models, soil maps, and land cover classifications. Many of the parameters were left at their default model value as they would need to be calibrated as part of the PRMS model development...
This data release contains daily gridded data reflecting surface water input from rainfall, rain on snow (mixed), and snowmelt for the conterminous United States for water years 1990 to 2023 (1990/10/01 to 2023/09/30). This release also contains annual estimates of gridded input seasonality (an index reflecting whether surface water input occurs within a concentrated period or is equally distributed throughout the year), precipitation seasonality, average snowmelt, rainfall and rain on snow rates, and finally, annual totals of each input type. Average snowmelt, rainfall and rain on snow rates were computed using days where values were greater than zero. Daily data were generated using precipitation input from the...
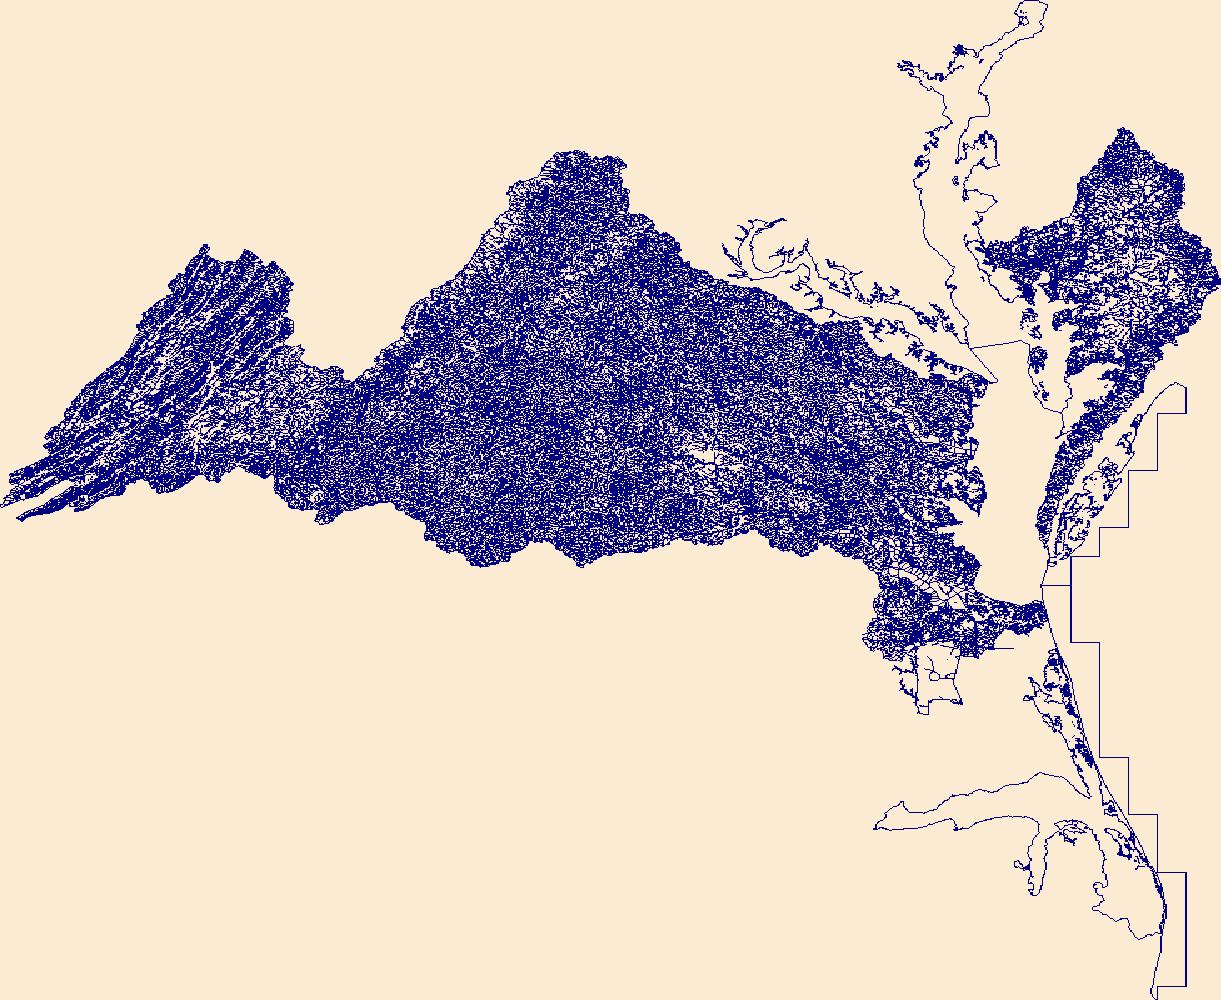
The High Resolution National Hydrography Dataset Plus (NHDPlus HR) is an integrated set of geospatial data layers, including the National Hydrography Dataset (NHD), National Watershed Boundary Dataset (WBD), and 3D Elevation Program Digital Elevation Model (3DEP DEM). The NHDPlus HR combines the NHD, 3DEP DEMs, and WBD to a data suite that includes the NHD stream network with linear referencing functionality, the WBD hydrologic units, elevation-derived catchment areas for each stream segment, "value added attributes" (VAAs), and other features that enhance hydrologic data analysis and routing.
These data were compiled for modeling efforts of Bureau of Reclamation National Environmental Policy Act (NEPA) analyses for the Colorado River in Grand Canyon, Arizona. Objective(s) of our study were to forecast water temperature, smallmouth bass population growth rate, and smallmouth bass entrainment rates under different water management scenarios. These data represent forecasted smallmouth bass entrainment rates and smallmouth bass population growth rates. Data were collected in 2023 and 2024 by the Bureau of Reclamation CRMMS and then used by the U.S. Geological Survey-Southwest Biological Science Center-Grand Canyon Monitoring & Research Center in the modeling process. These data can be used to evaluate different...
These data were compiled to predict economic impacts to angling in Glen Canyon and whitewater rafting in Grand Canyon. The objective of our study was to estimate recreation impacts, or changes in consumer surplus, under different future Interim Guidelines sEIS and LTEMP sEIS alternatives. These data include monthly impacts in nominal 2022 dollars. These data were created for operations at Glen Canyon Dam for October 2023 through November 2027. These data were created by the U.S. Geological Survey, Southwest Biological Science Center, Grand Canyon Monitoring and Research Center using mathematical modeling methods.
These data were compiled to assess potential impacts of altered operations of Glen Canyon Dam on riparian plant resources. Objective(s) of our study were to quantify potential responses of specific vegetation metrics. These data represent predicted changes in vegetation metrics based on the data in the Interim Guidelines and LTEMP_SEIS folders. These data were collected in Grand Canyon and Glen Canyon below the dam from 2014-2019. These data were collected by USGS SBSC scientists through ground-based vegetation surveys. These data can be used to predict responses of vegetation metrics only to the specific alterations to dam operations that were simulated.
|

|
