Filters: Tags: ocean (X)
266 results (292ms)|
Filters
Date Range
Extensions Types
Contacts
Categories Tag Types
|
The spring 2017 mainland sea otter count began on April 30, and although the shore-based counts were completed by May 12, 2017, the aerial counts were not completed until July 12, 2017. Overall viewing conditions this year were good, although not as good as conditions experienced during the 2016 spring census (View Score 2.4 versus 3.1, where 0=poor, 1=fair, 2=good, 3=very good, and 4=excellent). The surface canopies of kelp (Macrocystis sp.) were considered by most participants to be considerably below normal for this time of year in most areas of the mainland range. Sea otters along the mainland coast were surveyed from Pillar Point in San Mateo County in the north to Rincon Point in the south at the Santa Barbara/Ventura...
This dataset represents an archived record of annual California sea otter surveys from 1985-2014. Survey procedures involve counting animals during the "spring survey" -- generally beginning in late April or early May and usually ending in late May early June but may extend into early July, depending on weather conditions. Annual surveys are organized by survey year and within each year, three shapefiles are included: census summary of southern sea otter, extra limit counts of southern sea otter, and range extent of southern sea otter. The surveys, conducted cooperatively by scientists of the U.S. Geological Survey, California Department of Fish and Wildlife, U.S. Fish and Wildlife Service and Monterey Bay Aquarium...
Categories: Data;
Tags: California,
Central California Coastal,
Coast,
Southern California Coastal,
USGS Science Data Catalog (SDC),
Layered GeoPDF 7.5 Minute Quadrangle Map. Layers of geospatial data include orthoimagery, roads, grids, geographic names, elevation contours, hydrography, and other selected map features.
Layered geospatial PDF Map. Layers of geospatial data include orthoimagery, roads, grids, geographic names, elevation contours, hydrography, and other selected map features.
Layered GeoPDF 7.5 Minute Quadrangle Map. Layers of geospatial data include orthoimagery, roads, grids, geographic names, elevation contours, hydrography, and other selected map features.
Layered GeoPDF 7.5 Minute Quadrangle Map. Layers of geospatial data include orthoimagery, roads, grids, geographic names, elevation contours, hydrography, and other selected map features.
Layered GeoPDF 7.5 Minute Quadrangle Map. Layers of geospatial data include orthoimagery, roads, grids, geographic names, elevation contours, hydrography, and other selected map features.
Layered GeoPDF 7.5 Minute Quadrangle Map. Layers of geospatial data include orthoimagery, roads, grids, geographic names, elevation contours, hydrography, and other selected map features.
Layered GeoPDF 7.5 Minute Quadrangle Map. Layers of geospatial data include orthoimagery, roads, grids, geographic names, elevation contours, hydrography, and other selected map features.
Layered GeoPDF 7.5 Minute Quadrangle Map. Layers of geospatial data include orthoimagery, roads, grids, geographic names, elevation contours, hydrography, and other selected map features.
Layered GeoPDF 7.5 Minute Quadrangle Map. Layers of geospatial data include orthoimagery, roads, grids, geographic names, elevation contours, hydrography, and other selected map features.
Layered geospatial PDF Map. Layers of geospatial data include orthoimagery, roads, grids, geographic names, elevation contours, hydrography, and other selected map features.
Layered geospatial PDF Map. Layers of geospatial data include orthoimagery, roads, grids, geographic names, elevation contours, hydrography, and other selected map features.
Layered GeoPDF 7.5 Minute Quadrangle Map. Layers of geospatial data include orthoimagery, roads, grids, geographic names, elevation contours, hydrography, and other selected map features.
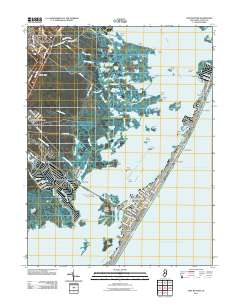
Layered GeoPDF 7.5 Minute Quadrangle Map. Layers of geospatial data include orthoimagery, roads, grids, geographic names, elevation contours, hydrography, and other selected map features.
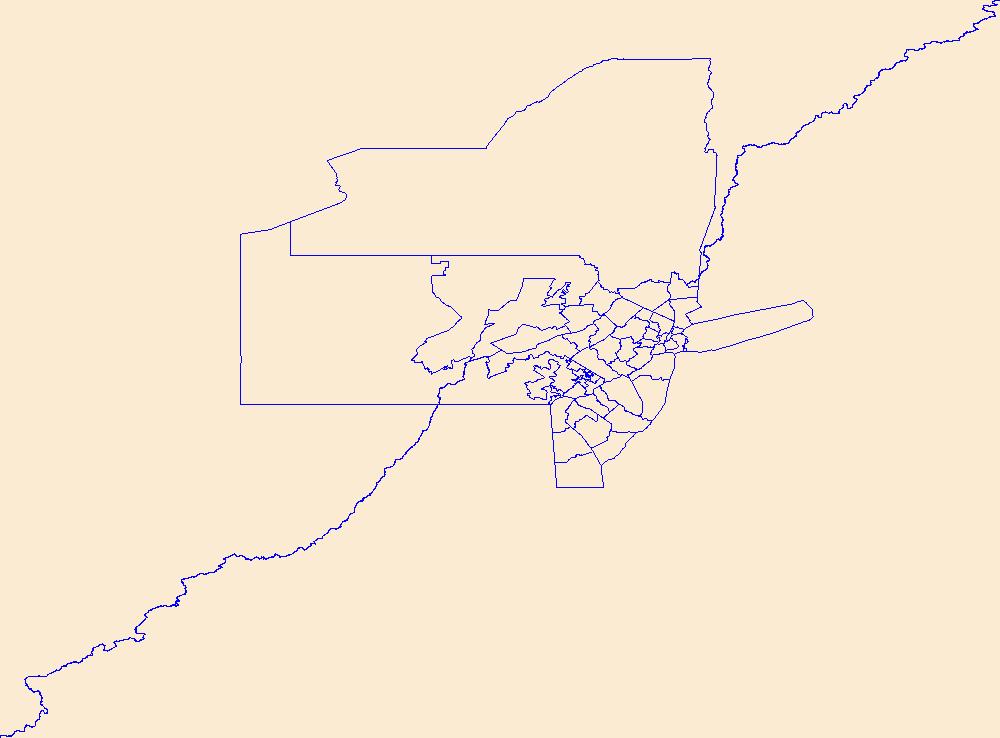
USGS National Boundary Dataset (NBD) in New Jersey State or Territory (published 20240215) Shapefile
Geospatial data is comprised of government boundaries.
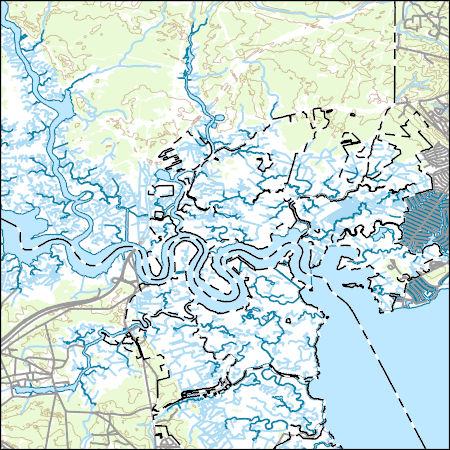
Layers of geospatial data include contours, boundaries, land cover, hydrography, roads, transportation, geographic names, structures, and other selected map features.
Layers of geospatial data include contours, boundaries, land cover, hydrography, roads, transportation, geographic names, structures, and other selected map features.
Types: Citation;
Tags: 7.5 x 7.5 minute,
7_5_Min,
Combined Vector,
Combined Vector,
Combined Vector,
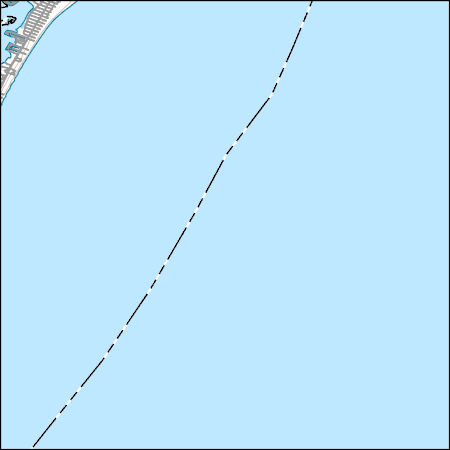
Layers of geospatial data include contours, boundaries, land cover, hydrography, roads, transportation, geographic names, structures, and other selected map features.
Layers of geospatial data include contours, boundaries, land cover, hydrography, roads, transportation, geographic names, structures, and other selected map features.
|