Filters: Extensions: ArcGIS REST Service (X)
Folders: ROOT > Users ( Show direct descendants )
20 results (42ms)
Location
Folder
ROOT _Users Filters
Date Range
Extensions Types
Contacts
Categories Tag Types
|
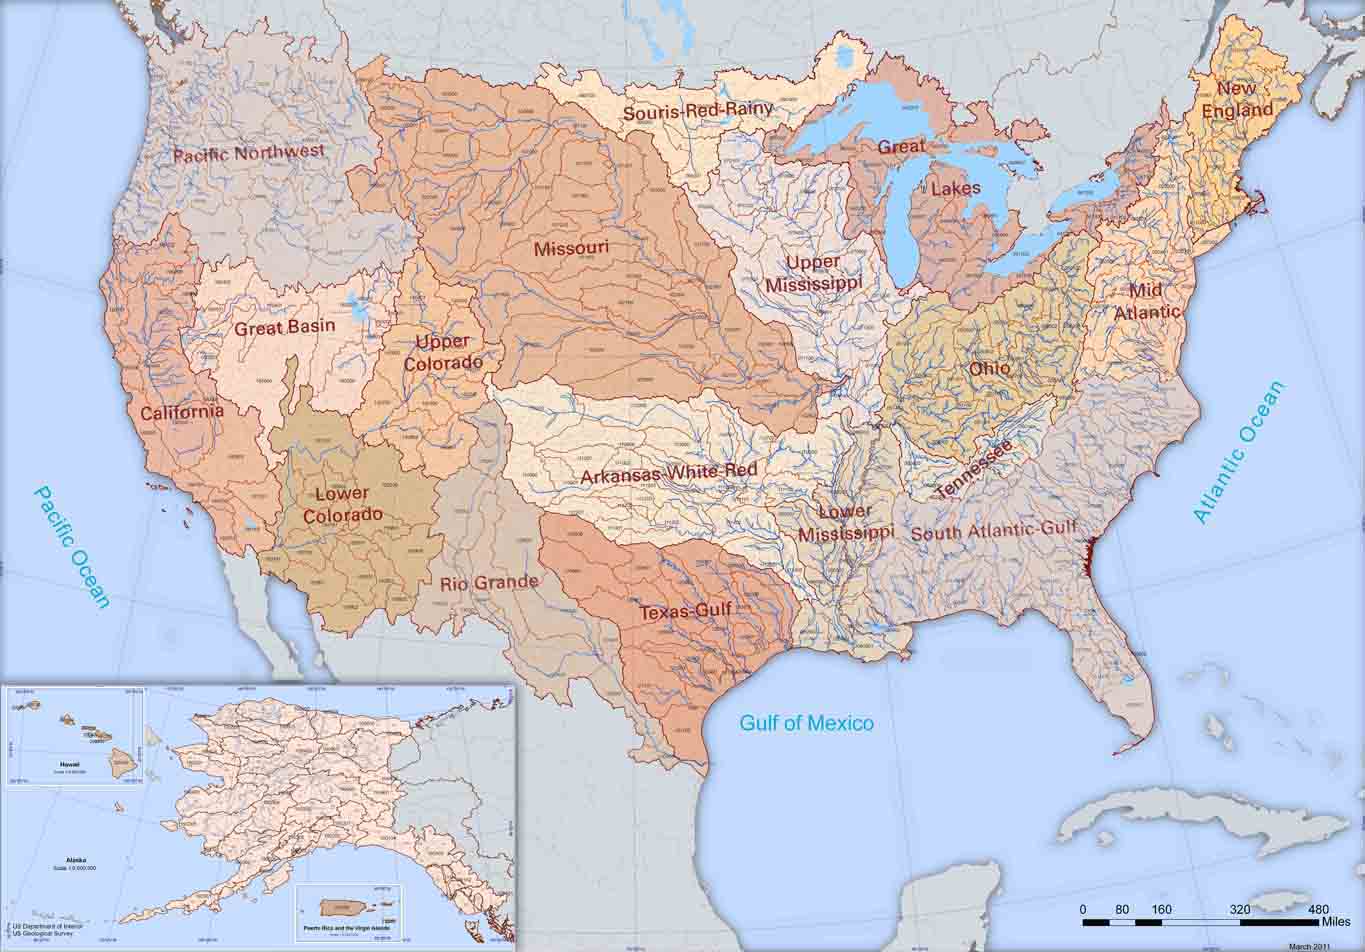
The Watershed Boundary Dataset (WBD) from The National Map (TNM) defines the perimeter of drainage areas formed by the terrain and other landscape characteristics. The drainage areas are nested within each other so that a large drainage area, such as the Upper Mississippi River, will be composed of multiple smaller drainage areas, such as the Wisconsin River. Each of these smaller areas can further be subdivided into smaller and smaller drainage areas. The WBD uses six different levels in this hierarchy, with the smallest averaging about 30,000 acres. The WBD is made up of polygons nested into six levels of data respectively defined by Regions, Subregions, Basins, Subbasins, Watersheds, and Subwatersheds. For additional...
This shapefile contains fish habitat condition index (HCI) scores as well as specific disturbance indices for 6th level Hydrologic Unit Code (HUC12) watersheds of the Watershed Boundary Dataset. The source datasets compiled and attributed to spatial units were identified as being: (1) meaningful for assessing fluvial fish habitat; (2) consistent across the entire study area in the way that they were assembled; (3) broadly representative of conditions in the past 10 years, and (4) of sufficient spatial resolution that they could be used to make valid comparisons among HUC12 units. In this data set, variable summaries are linked to HUC12 watersheds developed for the Watershed Boundary Dataset downloaded on March 18,...
Categories: Data;
Types: ArcGIS REST Map Service,
Map Service;
Tags: 2015 National Assessment,
2015 National Assessment,
DataProduct,
Direct habitat alteration,
Environmental condition,
This data set provides industrial-scale onshore wind turbine locations, corresponding facility information, and turbine technical specifications, in the United States to March 2014. The database has nearly 49,000 wind turbine records that have been collected, digitized, locationally verified, and internally quality assured and quality controlled. Turbines from the Federal Aviation Administration Digital Obstacle File, product date March 2, 2014, were used as the primary source of turbine data points. Verification of the position of turbines was done by visual interpretation using high-resolution aerial imagery in ESRI ArcGIS Desktop. Turbines without Federal Aviation Administration Obstacle Repository System (FAA...
Categories: Data;
Types: ArcGIS REST Map Service,
Citation,
Map Service;
Tags: Alabama,
Alaska,
Arizona,
Arkansas,
California,
This shapefile contains cumulative fish habitat condition index (HCI) scores as well as specific disturbance indices for local and network catchments of Southeast Alaska. Catchments were created in support of Jared Ross's Master’s thesis. The source datasets compiled and attributed to spatial units were identified as being: (1) meaningful for assessing fluvial fish habitat; (2) consistent across the entire study area in the way that they were assembled; (3) broadly representative of conditions in the past 10 years, and (4) of sufficient spatial resolution that they could be used to make valid comparisons among local catchment units. Citations: Ross, J.A. Influences of timber management and natural landscape factors...
Categories: Data;
Types: ArcGIS REST Map Service,
Citation,
Map Service;
Tags: 2015 National Assessment,
2015 National Assessment,
DataProduct,
Direct habitat alteration,
Environmental condition,
This CSV file contains cumulative fish habitat condition index (HCI) scores generated for river reaches of the conterminous United States as well as indices generated specifically for four spatial units including local and network catchments and 90 m local and network buffers of river reaches. Note that the cumulative HCI score is determined from limiting index scores generated for the four spatial units listed above. Detailed methods for calculating cumulative fish habitat condition index scores as well as the indices for each spatial extent can be found on the following website: http://assessment.fishhabitat.org/: The variables used to create indices in catchments vs. buffers differ due to differences in resolution...
Categories: Data;
Types: ArcGIS REST Map Service,
Map Service;
Tags: 2015 National Assessment,
2015 National Assessment,
Alabama,
Anthropogenic factors,
Aquatic habitats,
A point layer of sites known to be useful analogs for planetary science, such as impact craters, dunes, volcanoes, and other processes observed on bodies across the solar system.
This data provides locations and technical specifications of legacy and current versions of the United States Wind Turbines database. Almost all of which are utility-scale. Utility-scale turbines are ones that generate power and feed it into the grid, supplying a utility with energy. They are usually much larger than turbines that would feed a homeowner or business. Each release, typically done quarterly, updates the database with newly installed wind turbines, removes wind turbines that have been identified as dismantled, and applies other verifications based on updated imagery and ongoing quality-control. Turbine data were gathered from the Federal Aviation Administration's (FAA) Digital Obstacle File (DOF)...
Categories: Data;
Types: ArcGIS REST Map Service,
Map Service;
Tags: ACP,
American Clean Power,
LBNL,
USGS,
USWTDB,
Humans have dramatically altered wildlands in the western United States over the past 100 years by using these lands and the resources they provide. Anthropogenic changes to the landscape, such as urban expansion, construction of roads, power lines, and other networks and land uses necessary to maintain human populations influence the number and kinds of plants and wildlife that remain. We developed the map of the human footprint for the western United States from an analysis of 14 landscape structure and anthropogenic features: human habitation, interstate highways, federal and state highways, secondary roads, railroads, irrigation canals, power lines, linear feature densities, agricultural land, campgrounds, highway...
This web map provides a watershed index of surface drinking water importance, a watershed index of forest importance to surface drinking water, and a watershed index to highlight the extent to which development, fire, and insects and disease threaten forests important for surface drinking water. This tabular dataset is meant to be joined with the NRCS Watershed Boundary Dataset HUC-12. The results of this assessment provides information that can identify areas of interest for protecting surface drinking water quality. The spatial dataset can be incorporated into broad-scale planning, such as the State Forest Action Plans, and can be incorporated into existing decision support tools that currently lack spatial...
Categories: Data;
Types: ArcGIS REST Map Service,
Map Service;
Tags: Drinking water,
Forests,
HUC,
HUC12,
development,
Over 4,400 large scale commercial solar facilities are in operation in the United States as of December, 2021, representing over 60 gigawatts of electric power capacity; of these, over 3,900 are ground-mounted with capacities of 1MW or more, specified as large scale solar photovoltaic (LSPV) facilities. LSPV ground-mounted installations continue to grow, with over 400 projects coming online in 2021 alone. Currently, a comprehensive, publicly available georectified data describing the locations and spatial footprints of these facilities does not exist. Analysts from the US Geological Survey and Lawrence Berkeley National Laboratory collaborated to develop and release the United States Large Scale Solar Photovoltaic...
Categories: Data;
Types: ArcGIS REST Map Service,
Map Service,
OGC WFS Layer,
OGC WMS Layer,
OGC WMS Service;
Tags: Energy Resources,
Land Use Change,
Photovoltaic,
Solar,
USGS Science Data Catalog (SDC),
The National Agriculture Imagery Program (NAIP) acquires aerial imagery during the agricultural growing seasons in the continental U.S. A primary goal of the NAIP program is to make digital ortho photography available to governmental agencies and the public within a year of acquisition. NAIP is administered by the USDA's Farm Service Agency (FSA) through the Aerial Photography Field Office in Salt Lake City. This "leaf-on" imagery is used as a base layer for GIS programs in FSA's County Service Centers, and is used to maintain the Common Land Unit (CLU) boundaries. NAIP projects are contracted each year based upon available funding and the FSA imagery acquisition cycle. Beginning in 2003, NAIP was acquired...
The National Land Cover Database (NLCD) serves as the definitive Landsat-based, 30-meter resolution, land cover database for the Nation. NLCD provides spatial reference and descriptive data for characteristics of the land surface such as thematic class (for example, urban, agriculture, and forest), percent impervious surface, and percent tree canopy cover. NLCD supports a wide variety of Federal, State, local, and nongovernmental applications that seek to assess ecosystem status and health, understand the spatial patterns of biodiversity, predict effects of climate change, and develop land management policy. NLCD products are created by the Multi-Resolution Land Characteristics (MRLC) Consortium, a partnership of...
Categories: Data;
Types: ArcGIS REST Map Service,
Map Service,
OGC WFS Layer,
OGC WMS Layer,
OGC WMS Service;
Tags: GIS,
United States,
agriculture,
development,
grassland,
The dataset is composed of three data tables containing information from electrofishing and pebble count surveys conducted in tributaries to the Mohawk River in central and eastern New York during 2019. The first table contains information on the sampled reaches, the second table contains fish collection data, and the third table contains pebble count data.
Categories: Data,
Data Release - Revised;
Types: ArcGIS REST Map Service,
Map Service;
Tags: Ambient Monitoring,
Aquatic Biology,
Aquatic Community Health,
Ecosystem Health,
Mohawk River,
Detailed and accurate land cover and land cover change information is needed for South America because the continent is in constant flux, experiencing some of the highest rates of land cover change and forest loss in the world. The land cover data available for the entire continent are too coarse (250 m to 1 km) for resource managers, government and non-government organizations, and Earth scientists to develop conservation strategies, formulate resource management options, and monitor land cover dynamics. We used Landsat 30 m satellite data of 2010 and prepared the land cover database of South America using state-of-the-science remote sensing techniques. We produced regionally consistent and locally relevant land...
Categories: Data;
Types: ArcGIS REST Map Service,
Map Service,
OGC WFS Layer,
OGC WMS Layer,
OGC WMS Service;
Tags: Land Cover,
South America
This shapefile contains cumulative fish habitat condition index (HCI) scores and specific disturbance indices for local and network stream catchments as well as the downstream main channel catchment of perennial and intermittent streams reaches of the five main island of Hawai'i. In this dataset indices are linked to the Hawaii Fish Habitat Partnership (HFHP) stream layer (Tingley et al. in prep) which is a modified version of the 1:24,000 National Hydrography Dataset. It includes 11,436 intermittent and perennial stream reaches across the five main Hawaiian Islands (Hawai’i, Maui, Moloka’i, O’ahu, Kaua’i). Catchment attributes are available for both local catchments (defined as the land area draining directly to...
Categories: Data;
Types: ArcGIS REST Map Service,
Citation,
Map Service;
Tags: 2015 National Assessment,
2015 National Assessment,
Anthropogenic factors,
DataProduct,
Direct habitat alteration,
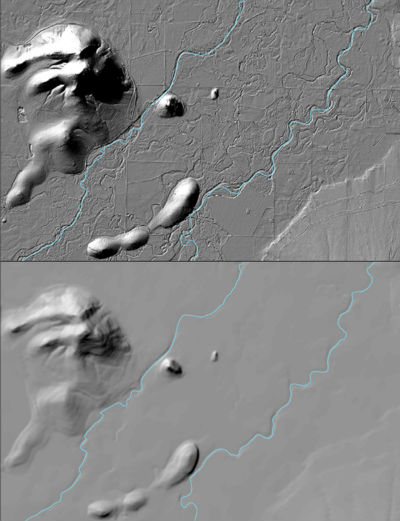
The USGS 3D Elevation Program (3DEP) Datasets from The National Map are the primary elevation data product produced and distributed by the USGS. The 3DEP program provides a variety of resolution raster elevation data of the conterminous United States, Alaska, Hawaii, and the island territories. Some of the data sets such as the 1/3rd arc-second and 1 arc-second data set are derived from diverse source data sets that are processed to a specification with a consistent resolution, coordinate system, elevation units, and horizontal and vertical datums. These seamless DEMs were referred to as the National Elevation Dataset (NED) from about 2000 through 2015 at which time they became the seamless DEM layers under the...
This geodatabase contains all the geologic map information for the Geologic Map of the San Juan caldera cluster, southwestern Colorado and is part of U.S. Geological Survey Geologic Investigations Map Series I-2799. The San Juan Mountains are the largest erosional remnant of a composite volcanic field that covered much of the southern Rocky Mountains in middle Tertiary time. The San Juan field consists mainly of intermediate-composition lavas and breccias, erupted about 35-30 Ma from scattered central volcanoes (Conejos Formation) and overlain by voluminous ash-flow sheets erupted from caldera sources. In the central San Juan Mountains, eruption of at least 8,800 km3 of dacitic-rhyolitic magma as nine major ash...
Categories: Data;
Types: ArcGIS REST Map Service,
ArcGIS Service Definition,
Downloadable,
Map Service;
Tags: Andesite,
Ash-flow tuff,
Basalt,
Central San Juan Caldera Cluster,
Central San Juan Mountains,
This data set represents the extent, approximate location and type of wetlands and deepwater habitats in the United States and its Trust Territories. These data delineate the areal extent of wetlands and surface waters as defined by Cowardin et al. (1979). Certain wetland habitats may be excluded because of the limitations of aerial imagery as the primary data source used to detect wetlands. These habitats include seagrasses or submerged aquatic vegetation that are found in the intertidal and subtidal zones of estuaries and near shore coastal waters. Some deepwater reef communities (coral or tuberficid worm reefs) have also been excluded from the inventory. These habitats, because of their depth, go undetected by...
Categories: Data;
Types: ArcGIS REST Map Service,
Map Service,
OGC WMS Layer;
Tags: Swamps, marshes, bogs, fens,
USFWS,
fens,
swamps,
wetlands
Note: this data release has been superseded by a new version 3.0 published in 2023. Find the new version here: https://doi.org/10.5066/P9DSRCZJ. During hydrocarbon production, water is typically co-produced from the geologic formations producing oil and gas. Understanding the composition of these produced waters is important to help investigate the regional hydrogeology, the source of the water, the efficacy of water treatment and disposal plans, potential economic benefits of mineral commodities in the fluids, and the safety of potential sources of drinking or agricultural water. The U.S. Geological Survey National Produced Waters Geochemical Database v2.3 is an updated compilation of geochemical and related information...
Categories: Data;
Types: ArcGIS REST Map Service,
Map Service;
Tags: USGS Science Data Catalog (SDC),
United States of America,
brine,
energy resources,
geochemistry,
This is a GIS Service for Phenology data from the Fort Collins Science Center. If you would like to add the data to your ArcMap session please add a GIS Service with the URL: https://www.sciencebase.gov/arcgis/services Please look in the 'phenology' folder.
|

|
