Folders: ROOT > ScienceBase Catalog > USGS Collections ( Show direct descendants )
71 results (79ms)
Location
Folder
ROOT _ScienceBase Catalog __USGS Collections Filters
Date Range
Extensions Types
Contacts
Categories Tag Types
|
The 2002 U.S. Geological Survey (USGS) National Seismic Hazard Maps display earthquake ground motions for various probability levels across the United States and are applied in seismic provisions of building codes, insurance rate structures, risk assessments, and other public policy. This update of the maps incorporates new findings on earthquake ground shaking, faults, seismicity, and geodesy. The resulting maps are derived from seismic hazard curves calculated on a grid of sites across the United States that describe the frequency of exceeding a set of ground motions.
Types: Citation;
Tags: B/C site class boundary,
EHP,
Earthquake Hazards Program,
GHSC,
Geologic Hazards Science Center,
Wildfire can significantly alter the hydrologic response of a watershed to the extent that even modest rainstorms can produce dangerous flash floods and debris flows. The USGS conducts post-fire debris-flow hazard assessments for select fires in the Western U.S. We use geospatial data related to basin morphometry, burn severity, soil properties, and rainfall characteristics to estimate the probability and volume of debris flows that may occur in response to a design storm.
ShakeMap is a product of the USGS Earthquake Hazards Program in conjunction with the regional seismic networks. ShakeMaps provide near-real-time maps of ground motion and shaking intensity following significant earthquakes. These maps are used by federal, state, and local organizations, both public and private, for post-earthquake response and recovery, public and scientific information, as well as for preparedness exercises and disaster planning.
Types: Citation;
Tags: ANSS,
Advanced National Seismic System,
ComCat,
Comprehensive Earthquake Catalog,
Earth,
A scenario represents one realization of a potential future earthquake by assuming a particular magnitude, location, and fault-rupture geometry and estimating shaking using a variety of strategies. In planning and coordinating emergency response, utilities, local government, and other organizations are best served by conducting training exercises based on realistic earthquake situations—ones similar to those they are most likely to face. ShakeMap Scenario earthquakes can fill this role. They can also be used to examine exposure of structures, lifelines, utilities, and transportation corridors to specified potential earthquakes. A ShakeMap earthquake scenario is a predictive ShakeMap with an assumed magnitude and...
Types: Citation;
Tags: Earthquake Hazards Program,
GHSC,
Geologic Hazards Science Center,
ShakeMap,
USGS,
The NEIC global earthquake bulletin is called the Preliminary Determination of Epicenters or PDE, and is one of many discrete products in the ANSS Comprehensive Catalog (ComCat). We use the word "Preliminary" for our final bulletin because the Bulletin of the International Seismological Centre is considered to be the final global archive of parametric earthquake data, in other words phase arrival (“pick”) times and amplitudes.
Types: Citation;
Tags: ANSS,
Advanced National Seismic System,
ComCat,
Comprehensive Earthquake Catalog,
Earth,
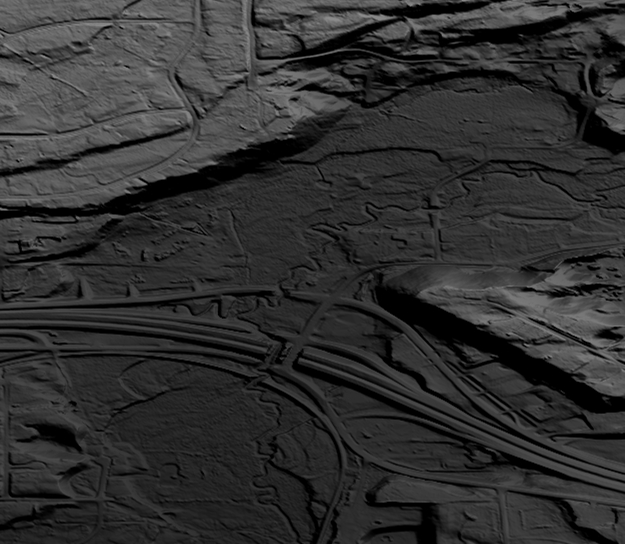
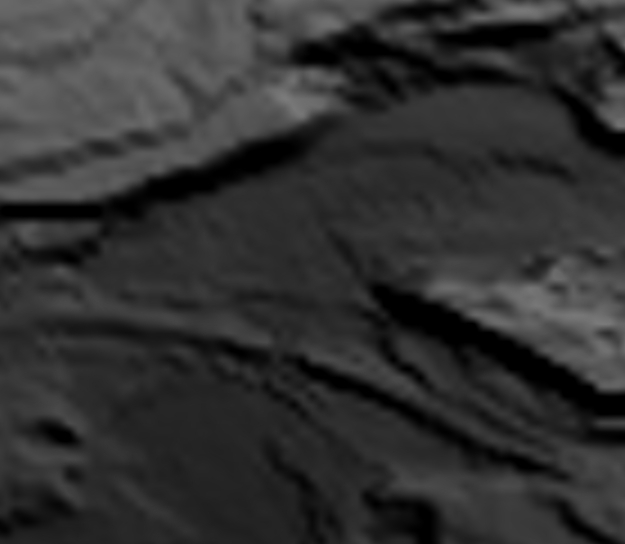
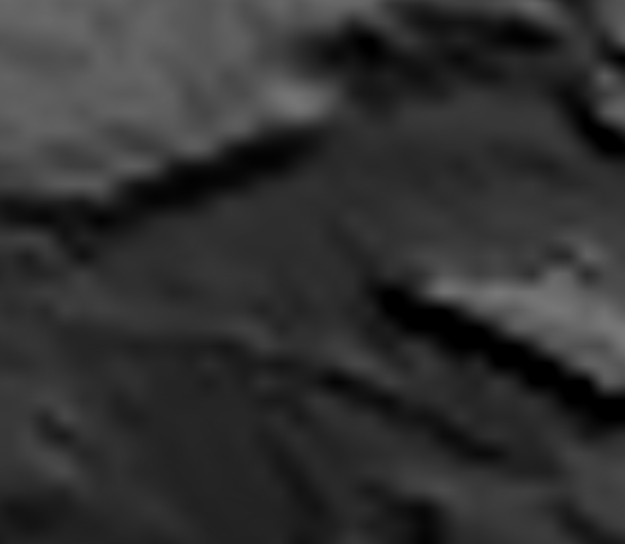
This is a tiled collection of the 3D Elevation Program (3DEP) and is 1/9 arc-second (approximately 3 m) resolution.The 3DEP data holdings serve as the elevation layer of The National Map, and provide foundational elevation information for earth science studies and mapping applications in the United States. Scientists and resource managers use 3DEP data for hydrologic modeling, resource monitoring, mapping and visualization, and many other applications. The elevations in this DEM represent the topographic bare-earth surface. The seamless 1/9 arc-second DEM layers are derived from diverse source data that are processed to a common coordinate system and unit of vertical measure. These data are distributed in geographic...
The data from the borehole strainmeter network set consists of raw data from the telemetry, state of health measurements, environmental measurement of temperature and pressure, and processed borehole strainmeter data. For each strainmeter site in this network, there will be a mix of raw data, SOH, environmental data, and processed strain. Each channel of data consists of a time of observation, usually 10-minute intervals, and a number that is either telemetry counts (which is proportional to the voltage output by the instrument), or in units of strain, which are either in part per million or parts per billion. Processed strain will be free of glitches and other artifacts and are corrected for changes in atmospheric...
Earthquake Hazards Program Data Sources includes the ANSS
Categories: Collection;
Tags: USGS Science Data Catalog (SDC)
Compiled Vs30 measurements obtained by studies funded by the U.S. Geological Survey (USGS) and other governmental agencies. Thus far, there are 2,997 sites in the United States, along with metadata for each measurement from government-sponsored reports, Web sites, and scientific and engineering journals. Most of the data originated from publications directly reporting the work of field investigators. A small subset (less than 20 percent) of Vs30 values was previously compiled by the USGS and other research institutions. Whenever possible, Vs30 originating from these earlier compilations were crosschecked against published reports. Both downhole and surface-based Vs30 estimates are represented. Most of the VS30 data...
Types: Citation;
Tags: Earth,
Earthquake Hazards Program,
GHSC,
Geologic Hazards Science Center,
USGS,
The U.S. Geological Survey (USGS) has generated land surface form classes for the contiguous United States. These land surface form classes were created as part of an effort to map standardized, terrestrial ecosystems for the nation using a classification developed by NatureServe (Comer and others, 2003). Ecosystem distributions were modeled using a biophysical stratification approach developed for South America (Sayre and others, 2008) and now being implemented globally (Sayre and others, 2007). Land surface forms strongly influence the differentiation and distribution of terrestrial ecosystems, and are one of the key input layers in the ecosystem delineation process.The methodology used to produce these land surface...
This suite of datasets consists of phenology data on over 1000 species of plants and animals (2009-present) and data on lilacs and honeysuckles (1956-present), across the United States. The data were collected by citizen and professional observers, and archived and distributed by the USA National Phenology Network (www.usanpn.org). Protocols are available in Denny et al, 2014 and datum is WGS84. This collection represents a suite of three data products: 1) Status and Intensity Data (phenophase status records of presence or absence of the phenophase, as well as information about the intensity with which the phenophase was expressed for each individual plant or species of animal at a site, on each visit by an observer),...
Types: Citation,
Map Service,
OGC WFS Layer,
OGC WMS Layer,
OGC WMS Service;
Tags: USGS Science Data Catalog (SDC),
ecology,
phenology
The National Hydrography Dataset (NHD) is a feature-based database that interconnects and uniquely identifies the stream segments or reaches that make up the nation's surface water drainage system. NHD data was originally developed at 1:100,000-scale and exists at that scale for the whole country. This high-resolution NHD, generally developed at 1:24,000/1:12,000 scale, adds detail to the original 1:100,000-scale NHD. (Data for Alaska, Puerto Rico and the Virgin Islands was developed at high-resolution, not 1:100,000 scale.) Local resolution NHD is being developed where partners and data exist. The NHD contains reach codes for networked features, flow direction, names, and centerline representations for areal water...
Categories: Data;
Types: Citation;
Tags: Administrative watershed units,
Area of Complex Channels,
Area to be submerged,
Basin,
Bay/Inlet,
The USA National Phenology Network has available a series of gridded products enabling researchers to analyze daily Accumulated Growing Degree Days (AGDD) from 2016 through the current year. Heat accumulation is commonly used as a way of predicting the timing of phenological transitions in plants and animals. Products generated by the USA-NPN begin accumulation on January 1 and use either a 32F or 50F base temperature.
THIS IS A HISTORICAL RECORD. As of December 17, 2021, the BISON application will no longer be available online and has been replaced by https://www.gbif.us. The BISON APIs are still available at https://bison.usgs.gov/#api and the Integrated Publishing Toolkit is still available at https://bison.usgs.gov/ipt. The USGS Biodiversity Information Serving Our Nation (BISON) project is an online all-species mapping information system consisting of a large collection of species occurrence datasets (e.g., plants and animals) found in the United States, U.S. Territories, U.S. marine Exclusive Economic Zones (EEZ), and Canada, with relevant geospatial layers. Species occurrences are records of organisms at a particular...
This is a tiled collection of the 3D Elevation Program (3DEP) and is 1 arc-second (approximately 30 m) resolution. The elevations in this Digital Elevation Model (DEM) represent the topographic bare-earth surface. The 3DEP data holdings serve as the elevation layer of The National Map, and provide foundational elevation information for earth science studies and mapping applications in the United States. Scientists and resource managers use 3DEP data for hydrologic modeling, resource monitoring, mapping and visualization, and many other applications.. The seamless 1 arc-second DEM layers are derived from diverse source data that are processed to a common coordinate system and unit of vertical measure. These data...
Types: Citation,
Map Service,
OGC WFS Layer,
OGC WMS Layer,
OGC WMS Service;
Tags: 1-Degree DEM,
3D Elevation Program,
3DEP,
Bare Earth,
Cartography,
This is a tiled collection of the 3D Elevation Program (3DEP) and is 2 arc-second (approximately 60 m) resolution covering Alaska. The elevations in this Digital Elevation Model (DEM) represent the topographic bare-earth surface. The 3DEP data holdings serve as the elevation layer of The National Map, and provide foundational elevation information for earth science studies and mapping applications in the United States. Scientists and resource managers use 3DEP data for hydrologic modeling, resource monitoring, mapping and visualization, and many other applications. The seamless 2 arc-second DEM layers are derived from diverse source data that are processed to a common coordinate system and unit of vertical measure....
Types: Citation,
Map Service,
OGC WFS Layer,
OGC WMS Layer,
OGC WMS Service;
Tags: 1-degree DEM,
2 arc-second DEM,
3DEP,
Bare Earth,
Cartography,
Geospatial data that is a derivative land cover product depicting woodland on topographic maps.
The USGS Geologic Hazards Science Center (GHSC) in Golden, CO maintains a GIS server with services pertaining to various geologic hazard disciplines involving earthquakes and landslides. The online link provides an overview of the structure of this server and also outlines the GIS data it contains. The folders named eq (earthquakes), haz (earthquake hazards), and ls (landlsides) contain services with data associated with each discipline.
|

|
