Filters: Tags: Montana (X) > Date Range: {"choice":"month"} (X)
84 results (40ms)|
Filters
Date Types (for Date Range)
Types Contacts
Categories Tag Types
|
This data release provides digital flight line data for a high-resolution airborne radiometric survey over parts of Montana in the vicinity of the Boulder Batholith. The airborne survey was jointly funded by the Earth Mapping Resources Initiative and Kennecott Exploration Company. The survey was designed to meet complementary needs related to geologic mapping and characterization of mineral resource potential. A total of 34,041 line km of magnetic and radiometric data were acquired over an irregular-shaped area of 6178 km2. Data were collected from a helicopter flown at a nominal terrain clearance of 100 meters (m) above topography along E-W flight lines spaced at 200 m intervals. Tie lines were flown in an N-S...
Categories: Data;
Types: Downloadable,
GeoTIFF,
Map Service,
Raster;
Tags: AASG,
Aeroradiometric survey,
Airborne geophysical survey,
Association of State Geologists,
Boulder Mountains,
This data release contains time series and plots summarizing mean monthly temperature and total monthly precipitation, and runoff from the U.S. Geological Survey Monthly Water Balance Model at 115 National Wildlife Refuges within the U.S. Fish and Wildlife Service Mountain-Prairie Region (CO, KS, MT, NE, ND, SD, UT, and WY). The three variables are derived from two sets of statistically-downscaled general circulation models from 1951 through 2099. The three variables were summarized for comparison across four 19-year periods: historic (1951-1969), baseline (1981-1999), 2050 (2041-2059), and 2080 (2071-2089). For each refuge, mean monthly plots, seasonal box plots, and annual envelope plots were produced for each...
Categories: Data;
Types: Downloadable,
Map Service,
OGC WFS Layer,
OGC WMS Layer,
Shapefile;
Tags: Climatology,
Colorado,
Hydrology,
Kansas,
Montana,
Layered geospatial PDF 7.5 Minute Quadrangle Map. Layers of geospatial data include orthoimagery, roads, grids, geographic names, elevation contours, hydrography, and other selected map features. This map is derived from GIS (geospatial information system) data. It represents a repackaging of GIS data in traditional map form, not creation of new information. The geospatial data in this map are from selected National Map data holdings and other government sources.
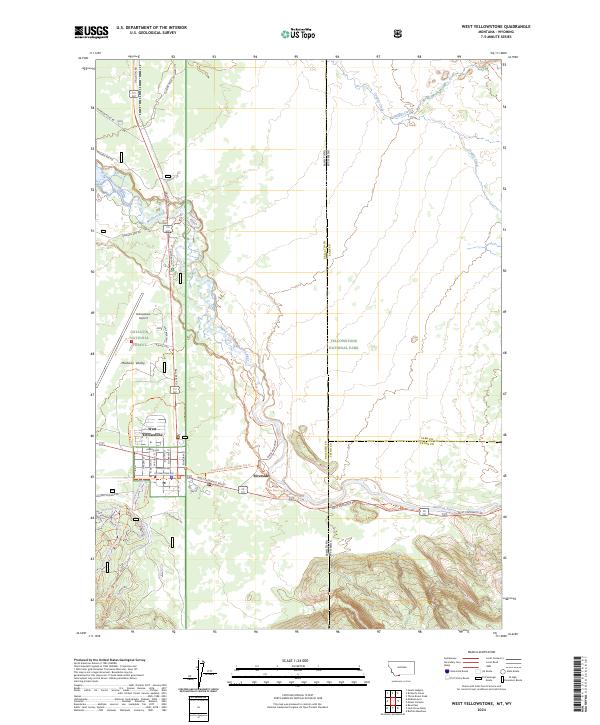
Layered geospatial PDF 7.5 Minute Quadrangle Map. Layers of geospatial data include orthoimagery, roads, grids, geographic names, elevation contours, hydrography, and other selected map features. This map is derived from GIS (geospatial information system) data. It represents a repackaging of GIS data in traditional map form, not creation of new information. The geospatial data in this map are from selected National Map data holdings and other government sources.
This dataset presents the total estimated monthly public-supply water withdrawal by 12-digit hydrologic unit code (HUC12) in the conterminous United States for 2015. Public-supply water use was estimated by spatially and temporally downscaling available data from each state. The total represents combined groundwater and surface water withdrawals for 83,178 watersheds. Public supply refers to water withdrawn by public and private water suppliers that provide water for cities, towns, rural water districts, mobile-home parks, Native American Indian reservations, and military bases. Public-supply facilities are classified under the Standard Industrial Classification (SIC) 4941 and provide water to at least 25 people...
These datasets provide early estimates of 2024 fractional cover for exotic annual grass (EAG) species and one native perennial grass species on a weekly basis from April to late June. Typically, the EAG estimates are publicly released within 7-13 days of the latest satellite observation used for that version. Each weekly release contains five fractional cover maps along with their corresponding confidence maps for: 1) a group of 16 species of EAGs, 2) cheatgrass (Bromus tectorum); 3) Field Brome (Bromus arvensis); 4) medusahead (Taeniatherum caput-medusae); and 5) Sandberg bluegrass (Poa secunda). These datasets were generated leveraging field observations from Bureau of Land Management (BLM) Assessment, Inventory,...
Categories: Data;
Types: Downloadable,
GeoTIFF,
Map Service,
Raster;
Tags: Arizona,
California,
Colorado,
Field Brome,
Great Basin,
These datasets provide early estimates of 2024 fractional cover for exotic annual grass (EAG) species and one native perennial grass species on a weekly basis from April to late June. Typically, the EAG estimates are publicly released within 7-13 days of the latest satellite observation used for that version. Each weekly release contains five fractional cover maps along with their corresponding confidence maps for: 1) a group of 16 species of EAGs, 2) cheatgrass (Bromus tectorum); 3) Field Brome (Bromus arvensis); 4) medusahead (Taeniatherum caput-medusae); and 5) Sandberg bluegrass (Poa secunda). These datasets were generated leveraging field observations from Bureau of Land Management (BLM) Assessment, Inventory,...
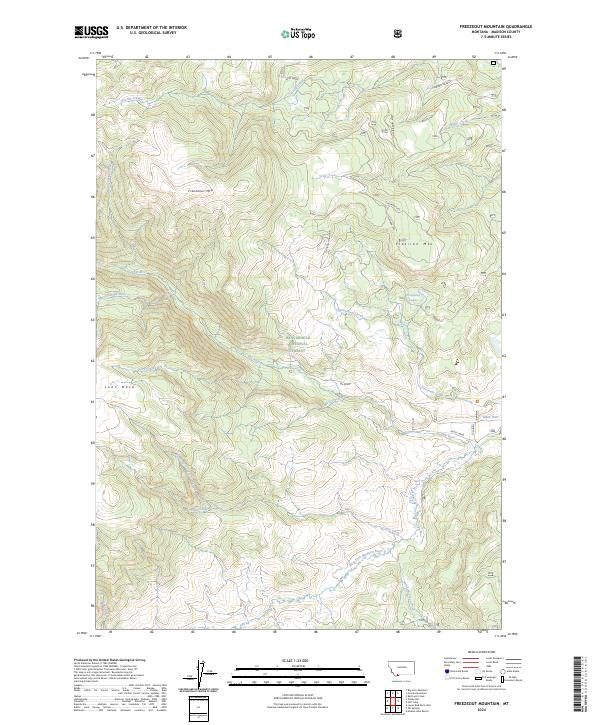
Layered geospatial PDF 7.5 Minute Quadrangle Map. Layers of geospatial data include orthoimagery, roads, grids, geographic names, elevation contours, hydrography, and other selected map features. This map is derived from GIS (geospatial information system) data. It represents a repackaging of GIS data in traditional map form, not creation of new information. The geospatial data in this map are from selected National Map data holdings and other government sources.
Layered geospatial PDF 7.5 Minute Quadrangle Map. Layers of geospatial data include orthoimagery, roads, grids, geographic names, elevation contours, hydrography, and other selected map features. This map is derived from GIS (geospatial information system) data. It represents a repackaging of GIS data in traditional map form, not creation of new information. The geospatial data in this map are from selected National Map data holdings and other government sources.
Layered geospatial PDF 7.5 Minute Quadrangle Map. Layers of geospatial data include orthoimagery, roads, grids, geographic names, elevation contours, hydrography, and other selected map features. This map is derived from GIS (geospatial information system) data. It represents a repackaging of GIS data in traditional map form, not creation of new information. The geospatial data in this map are from selected National Map data holdings and other government sources.
Layered geospatial PDF 7.5 Minute Quadrangle Map. Layers of geospatial data include orthoimagery, roads, grids, geographic names, elevation contours, hydrography, and other selected map features. This map is derived from GIS (geospatial information system) data. It represents a repackaging of GIS data in traditional map form, not creation of new information. The geospatial data in this map are from selected National Map data holdings and other government sources.
Layered geospatial PDF 7.5 Minute Quadrangle Map. Layers of geospatial data include orthoimagery, roads, grids, geographic names, elevation contours, hydrography, and other selected map features. This map is derived from GIS (geospatial information system) data. It represents a repackaging of GIS data in traditional map form, not creation of new information. The geospatial data in this map are from selected National Map data holdings and other government sources.
The U.S. Geological Survey is developing national water-use models to support water resources management in the United States. Model benefits include a nationally consistent estimation approach, greater temporal and spatial resolution of estimates, efficient and automated updates of results, and capabilities to forecast water use into the future and assess model uncertainty. This data release contains data used in a machine learning model to estimate monthly water use for communities that are supplied by public-supply water systems in the conterminous United States for 2000-2020. This data release also contains associated scripts used to produce input features as well as model output values by 12-digit hydrologic...
This dataset contains two- and quasi-three-dimensional hydrodynamic model outputs from the Flow and Sediment Transport with Morphologic Evolution of CHannels (FaSTMECH) hydrodynamic model in the open-source binary Visualization Toolkit (VTK) format (https://vtk.org/). The simulations were run at flows in the range of 185-635 cms at increments of 30 cms. This set of flow conditions pertains to the base lateral eddy viscosity scenario referred to as LEVx1 in Call et al., 2023. Files can be opened using the open-source software program Paraview: (https://www.paraview.org/).
These two datasets contain metrics from hydrodynamic and particle tracking simulations for two sub-reaches of the Upper Missouri River near Wolf Point, MT. The upstream reach is referred to as the “upper” reach while the downstream reach is referred to as the “lower” reach. Simulations were performed for 16 flows in the range of 185-635 cms at increments of 30 cms.
Peak-flow frequency analysis is crucial in various water-resources management applications, including floodplain management and critical structure design. Federal guidelines for peak-flow frequency analyses, provided in Bulletin 17C, assume that the statistical properties of the hydrologic processes driving variability in peak flows do not change over time and so the frequency distribution of annual peak flows is stationary. Better understanding of long-term climatic persistence and further consideration of potential climate and land-use changes have caused the assumption of stationarity to be reexamined. This data release contains input data and results of a study investigating hydroclimatic trends in peak streamflow...
Layered geospatial PDF 7.5 Minute Quadrangle Map. Layers of geospatial data include orthoimagery, roads, grids, geographic names, elevation contours, hydrography, and other selected map features. This map is derived from GIS (geospatial information system) data. It represents a repackaging of GIS data in traditional map form, not creation of new information. The geospatial data in this map are from selected National Map data holdings and other government sources.
Layered geospatial PDF 7.5 Minute Quadrangle Map. Layers of geospatial data include orthoimagery, roads, grids, geographic names, elevation contours, hydrography, and other selected map features. This map is derived from GIS (geospatial information system) data. It represents a repackaging of GIS data in traditional map form, not creation of new information. The geospatial data in this map are from selected National Map data holdings and other government sources.
Layered geospatial PDF 7.5 Minute Quadrangle Map. Layers of geospatial data include orthoimagery, roads, grids, geographic names, elevation contours, hydrography, and other selected map features. This map is derived from GIS (geospatial information system) data. It represents a repackaging of GIS data in traditional map form, not creation of new information. The geospatial data in this map are from selected National Map data holdings and other government sources.
In response to Executive Order 13817 of December 20, 2017, the U.S. Geological Survey (USGS) coordinated with the Bureau of Land Management (BLM) to identify 36 nonfuel minerals or mineral materials considered critical to the economic and national security of the United States (U.S.) (https://pubs.usgs.gov/of/2018/1021/ofr20181021.pdf). Acquiring information on possible domestic sources of these critical minerals is the rationale for the USGS Earth Mapping Resources Initiative (Earth MRI). The program, which partners the USGS with State Geological Surveys, Federal agencies, and the private sector, aims to collect new geological, geophysical, and topographic (lidar) data in key areas of the U.S. to stimulate mineral...
|

|
