Filters: Tags: North Dakota (X) > Date Range: {"choice":"year"} (X)
453 results (256ms)|
Filters
Date Types (for Date Range)
Types Contacts
Categories Tag Types
|
Layers of geospatial data include contours, boundaries, land cover, hydrography, roads, transportation, geographic names, structures, and other selected map features.
Layers of geospatial data include contours, boundaries, land cover, hydrography, roads, transportation, geographic names, structures, and other selected map features.
Layers of geospatial data include contours, boundaries, land cover, hydrography, roads, transportation, geographic names, structures, and other selected map features.
Types: Citation;
Tags: 7.5 x 7.5 minute,
7_5_Min,
Combined Vector,
Combined Vector,
Combined Vector,
Layers of geospatial data include contours, boundaries, land cover, hydrography, roads, transportation, geographic names, structures, and other selected map features.
Types: Citation;
Tags: 7.5 x 7.5 minute,
7_5_Min,
Combined Vector,
Combined Vector,
Combined Vector,
Across the country, public land managers make hundreds of decisions each year that influence landscapes and ecosystems within the lands they manage. Many of these decisions involve vegetation manipulations known as land treatments. Land treatments include activities such as removal or alteration of plant biomass, seeding burned areas, and herbicide applications. Data on these land treatments historically have been stored at local offices and gathering information across large spatial areas was difficult. These valuable data needed to be centralized and stored for Federal agencies involved in land treatments because these data are useful to land managers for policy and management and to scientists for developing...
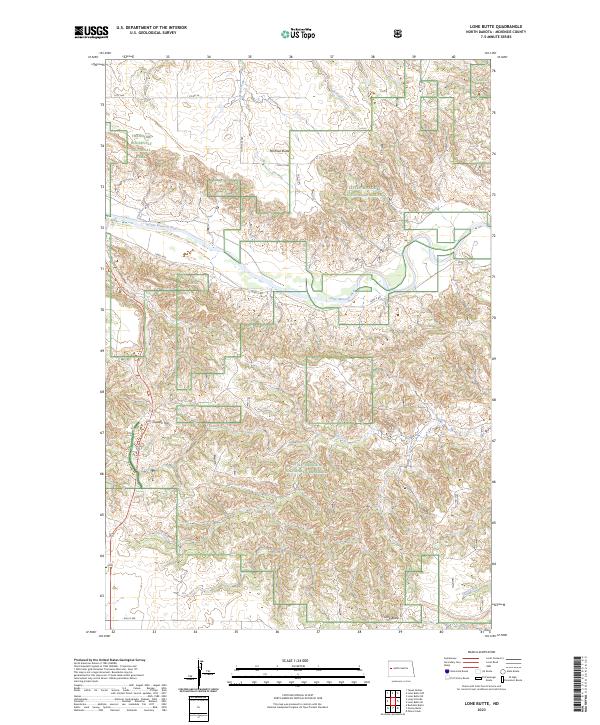
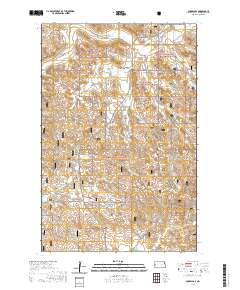
Layered geospatial PDF 7.5 Minute Quadrangle Map. Layers of geospatial data include orthoimagery, roads, grids, geographic names, elevation contours, hydrography, and other selected map features. This map is derived from GIS (geospatial information system) data. It represents a repackaging of GIS data in traditional map form, not creation of new information. The geospatial data in this map are from selected National Map data holdings and other government sources.
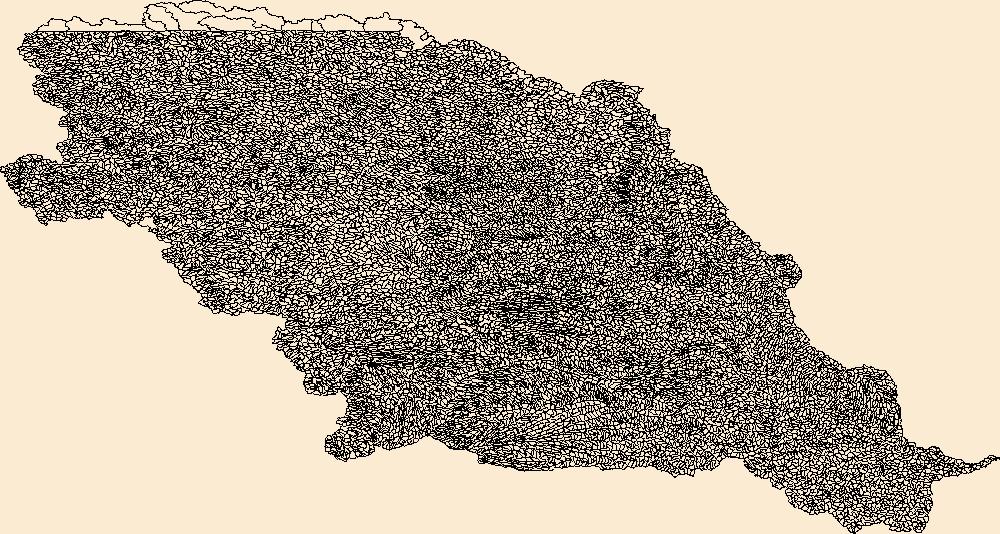
The Watershed Boundary Dataset (WBD) is a comprehensive aggregated collection of hydrologic unit data consistent with the national criteria for delineation and resolution. It defines the areal extent of surface water drainage to a point except in coastal or lake front areas where there could be multiple outlets as stated by the "Federal Standards and Procedures for the National Watershed Boundary Dataset (WBD)" "Standard" (https://pubs.usgs.gov/tm/11/a3/). Watershed boundaries are determined solely upon science-based hydrologic principles, not favoring any administrative boundaries or special projects, nor particular program or agency. This dataset represents the hydrologic unit boundaries to the 12-digit (6th level)...
Layered geospatial PDF 7.5 Minute Quadrangle Map. Layers of geospatial data include orthoimagery, roads, grids, geographic names, elevation contours, hydrography, and other selected map features. This map is derived from GIS (geospatial information system) data. It represents a repackaging of GIS data in traditional map form, not creation of new information. The geospatial data in this map are from selected National Map data holdings and other government sources.
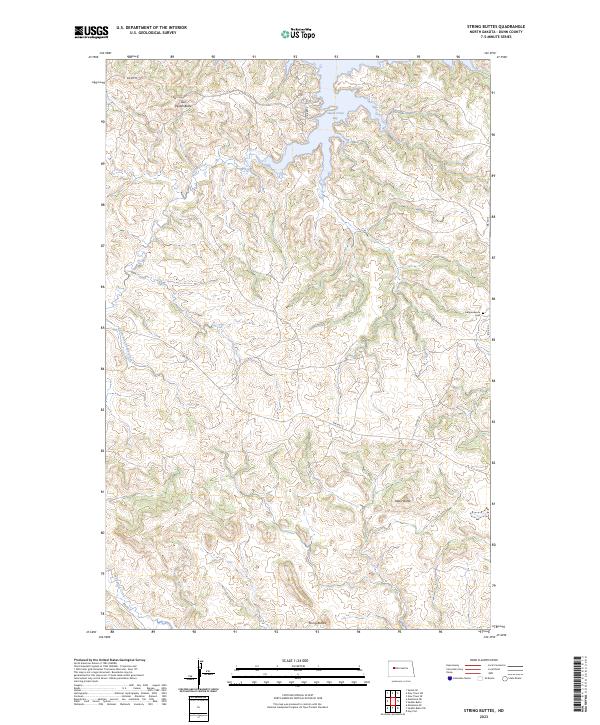
Layered geospatial PDF 7.5 Minute Quadrangle Map. Layers of geospatial data include orthoimagery, roads, grids, geographic names, elevation contours, hydrography, and other selected map features. This map is derived from GIS (geospatial information system) data. It represents a repackaging of GIS data in traditional map form, not creation of new information. The geospatial data in this map are from selected National Map data holdings and other government sources.
Layered geospatial PDF 7.5 Minute Quadrangle Map. Layers of geospatial data include orthoimagery, roads, grids, geographic names, elevation contours, hydrography, and other selected map features. This map is derived from GIS (geospatial information system) data. It represents a repackaging of GIS data in traditional map form, not creation of new information. The geospatial data in this map are from selected National Map data holdings and other government sources.
This data release contains data associated with the journal article "Modeling the maturation history of the stacked petroleum systems of the Williston Basin, USA". Collectively, the data release includes 13 child items and metadata files that provide detailed descriptions of the attributes, processing steps, and original data sources. There is also a data table, "Williston_Basin_Data_Release_Overview.csv" that describes how all the child items are linked with one another.
Categories: Data;
Tags: Bakken,
Cedar Creek Anticline,
Energy Resources,
Information Sciences,
Mineral Resources,
Layered geospatial PDF 7.5 Minute Quadrangle Map. Layers of geospatial data include orthoimagery, roads, grids, geographic names, elevation contours, hydrography, and other selected map features. This map is derived from GIS (geospatial information system) data. It represents a repackaging of GIS data in traditional map form, not creation of new information. The geospatial data in this map are from selected National Map data holdings and other government sources.
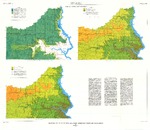
These data were released prior to the October 1, 2016 effective date for the USGS’s policy dictating the review, approval, and release of scientific data as referenced in USGS Survey Manual Chapter 502.8 Fundamental Science Practices: Review and Approval of Scientific Data for Release. This coverage contains information about the probability of obtaining a water supply within the Standing Rock Indian Reservation, Sioux County, North Dakota, and Corson County, South Dakota. The digital data were produced by the U.S. Geological Survey (USGS) in cooperation with the U.S. Environmental Protection Agency. The possibility of obtaining adequate supplies of good quality water from surficial deposits generally is limited...

The Geographic Names Information System (GNIS) is the Federal standard for geographic nomenclature. The U.S. Geological Survey developed the GNIS for the U.S. Board on Geographic Names, a Federal inter-agency body chartered by public law to maintain uniform feature name usage throughout the Government and to promulgate standard names to the public. The GNIS is the official repository of domestic geographic names data; the official vehicle for geographic names use by all departments of the Federal Government; and the source for applying geographic names to Federal electronic and printed products of all types.

The Geographic Names Information System (GNIS) is the Federal standard for geographic nomenclature. The U.S. Geological Survey developed the GNIS for the U.S. Board on Geographic Names, a Federal inter-agency body chartered by public law to maintain uniform feature name usage throughout the Government and to promulgate standard names to the public. The GNIS is the official repository of domestic geographic names data; the official vehicle for geographic names use by all departments of the Federal Government; and the source for applying geographic names to Federal electronic and printed products of all types.

The Geographic Names Information System (GNIS) is the Federal standard for geographic nomenclature. The U.S. Geological Survey developed the GNIS for the U.S. Board on Geographic Names, a Federal inter-agency body chartered by public law to maintain uniform feature name usage throughout the Government and to promulgate standard names to the public. The GNIS is the official repository of domestic geographic names data; the official vehicle for geographic names use by all departments of the Federal Government; and the source for applying geographic names to Federal electronic and printed products of all types.
The Williston Basin, located in the NorthernGreat Plains, is experiencing rapid energy developmentwith North Dakota and Montana being the epicenter ofcurrent and projected development in the USA. Theaverage single-bore well pad is 5 acres with an estimated58,485 wells in North Dakota alone. This landscapeleveldisturbance may provide a pathway for the establishmentof non-native plants. To evaluate potentialinfluences of energy development on the presence andabundance of non-native species, vegetation surveyswere conducted at 30 oil well sites (14 ten-year-oldand 16 five-year-old wells) and 14 control sites in nativeprairie environments across the Williston Basin. Nonnativespecies richness and cover were recorded...
Categories: Data,
Publication;
Types: Citation,
Map Service,
OGC WFS Layer,
OGC WMS Layer,
OGC WMS Service;
Tags: 2013,
Conservation NGOs,
EARTH SCIENCE > LAND SURFACE > LANDSCAPE,
Federal resource managers,
LCC,
Climate change over the past century has altered vegetation community composition and species distributions across rangelands in the western United States. The scale and magnitude of climatic influences are largely unknown. We used fractional component cover data for rangeland functional groups and weather data from the 1985 to 2023 reference period in conjunction with soils and topography data to develop empirical models describing the spatio-temporal variation in component cover. To investigate the ramifications of future change across the western US, we extended models based on historical relationships over the reference period to model landscape effects based on future weather conditions from two emissions scenarios...
This child item describes Python code used to estimate average yearly and monthly tourism per 1000 residents within public-supply water service areas. Increases in population due to tourism may impact amounts of water used by public-supply water systems. This data release contains model input datasets, Python code used to develop the tourism information, and output estimates of tourism. This dataset is part of a larger data release using machine learning to predict public supply water use for 12-digit hydrologic units from 2000-2020. Output from this code was used as an input feature in the public supply delivery and water use machine learning models. This page includes the following files: tourism_input_data.zip...
This child item describes a public supply delivery machine learning model that was developed to estimate public-supply deliveries. Publicly supplied water may be delivered to domestic users or to commercial, industrial, institutional, and irrigation (CII) users. This model predicts total, domestic, and CII per capita rates for public-supply water service areas within the conterminous United States for 2009-2020. This child item contains model input datasets, code used to build the delivery machine learning model, and national predictions. This dataset is part of a larger data release using machine learning to predict public-supply water use for 12-digit hydrologic units from 2000-2020. This page includes the following...
|

|
