Filters: Tags: Ohio (X)
7,301 results (188ms)|
Filters
Date Range
Extensions
Types
Contacts
Categories Tag Types
|
Field spikes were prepared at 207 stream and river sites as part of the U.S. Geological Survey (USGS) National Water Quality Assessment (NAWQA) project between December, 2012, and September, 2015. At the field site, a depth-and width-integrated environmental sample was collected, and one subsample of the environmental sample was spiked with a known amount of a spike mixture. Both the spiked subsample ("spike sample") and another subsample ("environmental sample") of the original water sample were analyzed for pesticides at the USGS National Water Quality Laboratory (NWQL) by direct injection liquid chromatography with tandem mass spectrometry (LC-MS/MS), and were used to calculate the spike recovery of each analyte....
The glacial aquifer system of the United States encompasses all or parts of 25 states and is the most widely used supply of drinking water in the Nation (Maupin and Barber, 2005; Maupin and Arnold, 2010). A series of seven raster data sets were derived from a database of water-well drillers' records that was compiled in partial fulfillment of the goals of the U.S. Geological Survey’s Groundwater Availability and Use assessment program (U.S. Geological Survey, 2002). They contain hydrogeologic information for areas of the U.S. that are north of the southern limit of Pleistocene glaciation, including the total thickness of glacial deposits, thickness of coarse-grained sediment within the glacial deposits, specific-capacity...

This map layer consists of federally owned or administered lands of the United States, Puerto Rico, and the U.S. Virgin Islands. For the most part, only areas of 320 acres or more are included; some smaller areas deemed to be important or significant are also included. There may be private inholdings within the boundaries of Federal lands in this map layer. Some established Federal lands which are larger than 320 acres are not included in this map layer, because their boundaries were not available from the owning or administering agency.
This data set includes WRTDS nutrient flux trend results and the values of daily streamflow trend results displayed in the Quantile-Kendall plots. For 1995-2015 nutrient trends, the method of generalized flow normalization (FNG) was used which explicitly addresses non-stationary streamflow conditions. For 2005-2015 nutrient trends, the WRTDS trend analyses used the method of stationary flow normalization (FNS) because streamflow nonstationarity is difficult to assess over this shorter duration time frame. The 1995-2015 annual nutrient trends were determined for all five nutrient parameters (TP, SRP, TN, NO23, TKN), and monthly trends were evaluated only for SRP. The 2005-2015 annual nutrient trends were determined...
This dataset provides timeseries data on water quality and quantity, as collected or computed from outside sources. The format is many tables with one row per time series observation (1 tab-delimited file per site-variable combination, 1 zip file per site). This compilation of data is intended for use in estimating or interpreting metabolism. Sites were included if they met the initial criteria of having at least 100 dissolved oxygen observations and one of the accepted NWIS site types ('ST','ST-CA','ST-DCH','ST-TS', or 'SP'). This dataset is part of a larger data release of metabolism model inputs and outputs for 356 streams and rivers across the United States (https://doi.org/10.5066/F70864KX). The complete release...
The glacial aquifer system of the United States encompasses all or parts of 25 states and is the most widely used supply of drinking water in the Nation (Maupin and Barber, 2005; Maupin and Arnold, 2010). A series of seven raster data sets were derived from a database of water-well drillers' records that was compiled in partial fulfillment of the goals of the U.S. Geological Survey’s Groundwater Availability and Use assessment program (U.S. Geological Survey, 2002). They contain hydrogeologic information for areas of the U.S. that are north of the southern limit of Pleistocene glaciation, including the total thickness of glacial deposits, thickness of coarse-grained sediment within the glacial deposits, specific-capacity...
The data document the results of several microbe bioassays performed by the USGS on Phragmites australis plants, including those performed on mature leaves, seedlings, and dead leaf tissues exploration of the literature to find accounts of microbes associated with Phragmites worldwide. For the bioassays, we prepared 162 pure cultures isolated from Phragmites plants in North America along the east coast, Florida, the Gulf of Mexico, and the Great Lakes area, 125 of which were from a previous study, and 38 represent new collections. The DNA sequences used to identify the 37 new collections are included. Microbes were isolated from plants collected from 2015-2018. We performed assays using both North American plant...
This Benthic Invertebrate Community Analysis dataset, a conceptual subgroup of the Lake Erie Ecological Investigations (LEEI) dataset, focuses on the benthic invertebrates sampled at Areas of Concern (AOCs) on Lake Erie. Per the Quality Assurance Project Plan (QAPP), the invertebrate samples were taken from sediments remaining from the sediment analysis. Identification of the invertebrates was completed by the same invertebrate taxonomist for both the 1998-2000 evaluation and 1986-87 historical evaluation (Smith et al. 1994) for increased consistency. Oligochaetes were identified to species if possible, chironomids were identified to genus, as adult specimens are needed for specific identification, and other taxa...
This shapefile is the official boundary of the Eastern Brook Trout Joint Venture. The boundary was originally developed by the United States Fish and Wildlife Service and was updated in 2013 to reflect revisions from the Eastern Brook Trout Joint Venture, a recognized Fish Habitat Partnership (FHP) of the National Fish Habitat Partnership.
Categories: Data;
Types: ArcGIS REST Map Service,
ArcGIS Service Definition,
Downloadable,
GeoTIFF,
Map Service,
Raster;
Tags: Analytical boundary,
Aquatic habitats,
Boundaries,
EBTJV,
FHP Boundary,
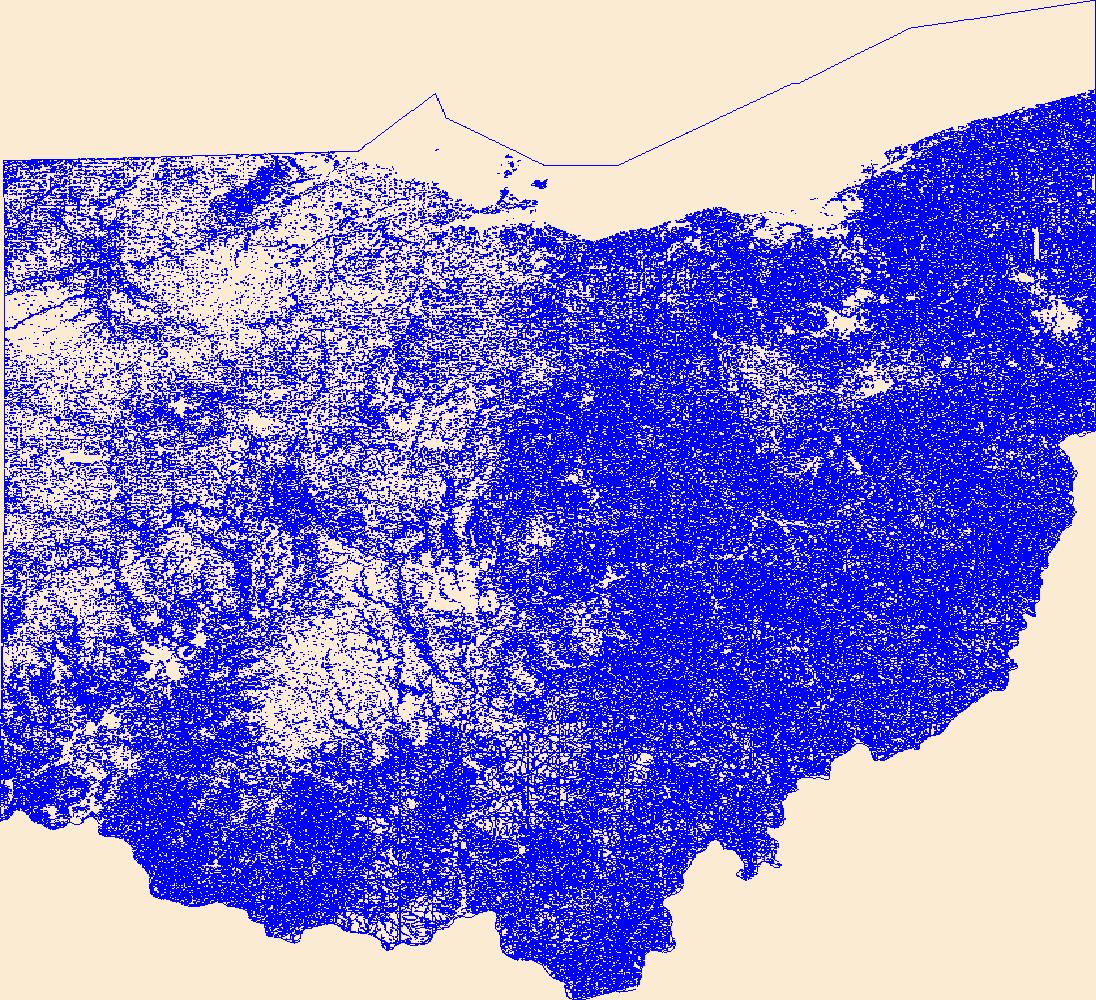
Geospatial data that is a derivative land cover product depicting woodland on topographic maps.
Digital flood-inundation maps for an approximate 2.5-mile (mi) reach of the Clear Fork Mohican River that extends approximately from State Route 97 to the downstream corporate boundary for Bellville, Ohio, were created by the U.S. Geological Survey (USGS) in cooperation with the Muskingum Watershed Conservancy District. The flood-inundation maps show estimates of the areal extent and depth of flooding corresponding to selected water levels (stages) at the USGS streamgage on the Clear Fork Mohican River at Bellville (station number 03131982). The maps can be accessed through the USGS Flood Inundation Mapping Science Web site at http://water.usgs.gov/osw/flood_inundation/. Near-real-time stages at this streamgage...
Categories: Data;
Tags: Clear Fork Mohican River,
Ohio,
Richland County,
Richland County, Ohio,
flood inundation mapping,
The depth grids show the depth of flooding on the Clear Fork Mohican River near Bellville, Ohio on local map backgrounds, based on stages of 9.0 ft to 17.0 ft at the USGS streamgage, Clear Fork Mohican River at Bellville, Ohio, 03131982.
Categories: Data;
Tags: Bellville,
Clear Fork Mohican River,
Ohio,
Richland County,
Richland County, Ohio,

This map layer shows Indian lands of the United States. For the most part, only areas of 320 acres or more are included; some smaller areas deemed to be important or significant are also included. Federally-administered lands within a reservation are included for continuity; these may or may not be considered part of the reservation and are simply described with their feature type and the administrating Federal agency. Some established Indian lands which are larger than 320 acres are not included in this map layer because their boundaries were not available from the owning or administering agency.
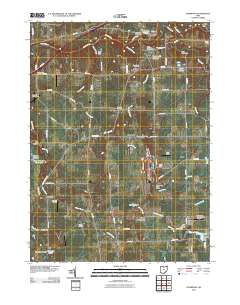
Layered GeoPDF 7.5 Minute Quadrangle Map. Layers of geospatial data include orthoimagery, roads, grids, geographic names, elevation contours, hydrography, and other selected map features.
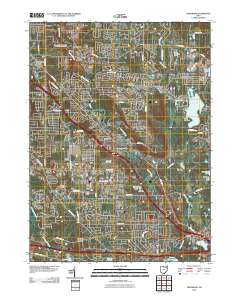
Layered GeoPDF 7.5 Minute Quadrangle Map. Layers of geospatial data include orthoimagery, roads, grids, geographic names, elevation contours, hydrography, and other selected map features.
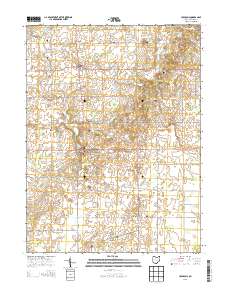
Layered GeoPDF 7.5 Minute Quadrangle Map. Layers of geospatial data include orthoimagery, roads, grids, geographic names, elevation contours, hydrography, and other selected map features.
Layered GeoPDF 7.5 Minute Quadrangle Map. Layers of geospatial data include orthoimagery, roads, grids, geographic names, elevation contours, hydrography, and other selected map features.
Layered geospatial PDF Map. Layers of geospatial data include orthoimagery, roads, grids, geographic names, elevation contours, hydrography, and other selected map features.
|