Filters: Tags: United States of America (X)
2,479 results (22ms)|
Filters
Date Range
Extensions
Types
Contacts
Categories
Tag Types
|
Ecological models facilitate the evaluation and assessment of alternative approaches to restore the Greater Everglades ecosystem. Joint Ecosystem Modeling (JEM) provides ecological models tailored to address specific management issues. The multi-agency REstoration, COordination and VERification (RECOVER) science team uses ecological models (i.e., ecological planning tools) to evaluate the potential effects of projects in the Comprehensive Everglades Restoration Plan (CERP) on natural resources. The planning agencies and bureaus involved in CERP desire to also use these ecological planning tools for the evaluation of alternative water control plans to be performed by the Lake Okeechobee System Operating Manual (LOSOM)...
Ecological models facilitate the evaluation and assessment of alternative approaches to restore the Greater Everglades ecosystem. Joint Ecosystem Modeling (JEM) provides ecological models tailored to address specific management issues. The multi-agency REstoration, COordination and VERification (RECOVER) science team uses ecological models (i.e., ecological planning tools) to evaluate the potential effects of projects in the Comprehensive Everglades Restoration Plan (CERP) on natural resources. The planning agencies and bureaus involved in CERP desire to also use these ecological planning tools for the evaluation of alternative water control plans to be performed by the Lake Okeechobee System Operating Manual (LOSOM)...

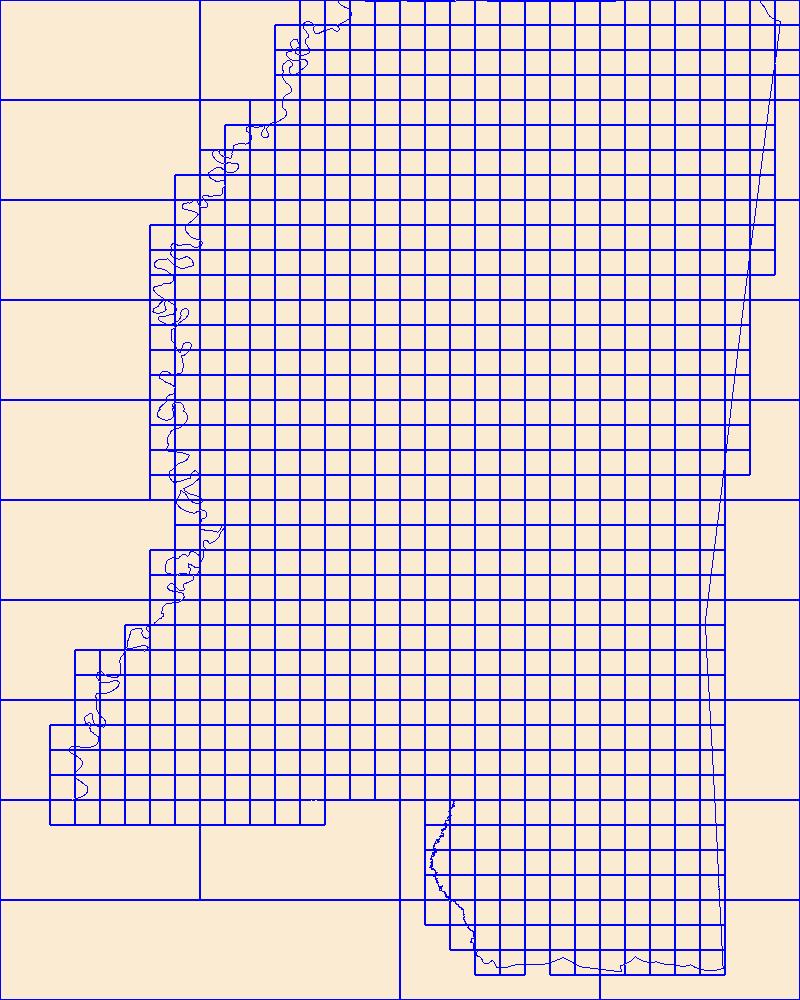
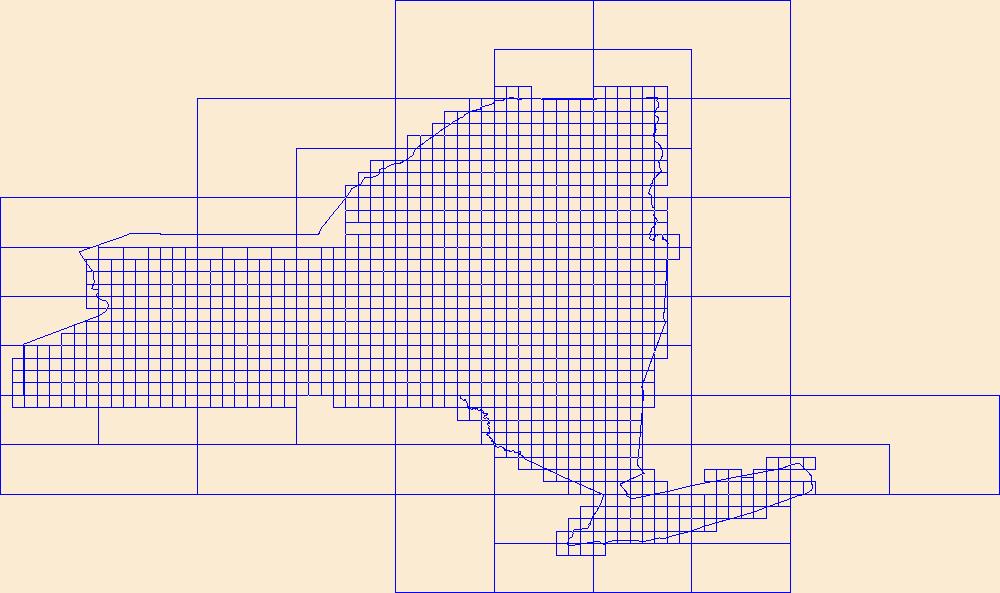
This data represents the map extent for current and historical USGS topographic maps for the United States and Territories, including 1 X 2 Degree, 1 X 1 Degree, 30 X 60 Minute, 15 X 15 Minute, 7.5 X 7.5 Minute, and 3.75 X 3.75 Minute. The grid was generated using ESRI ArcInfo GIS software.
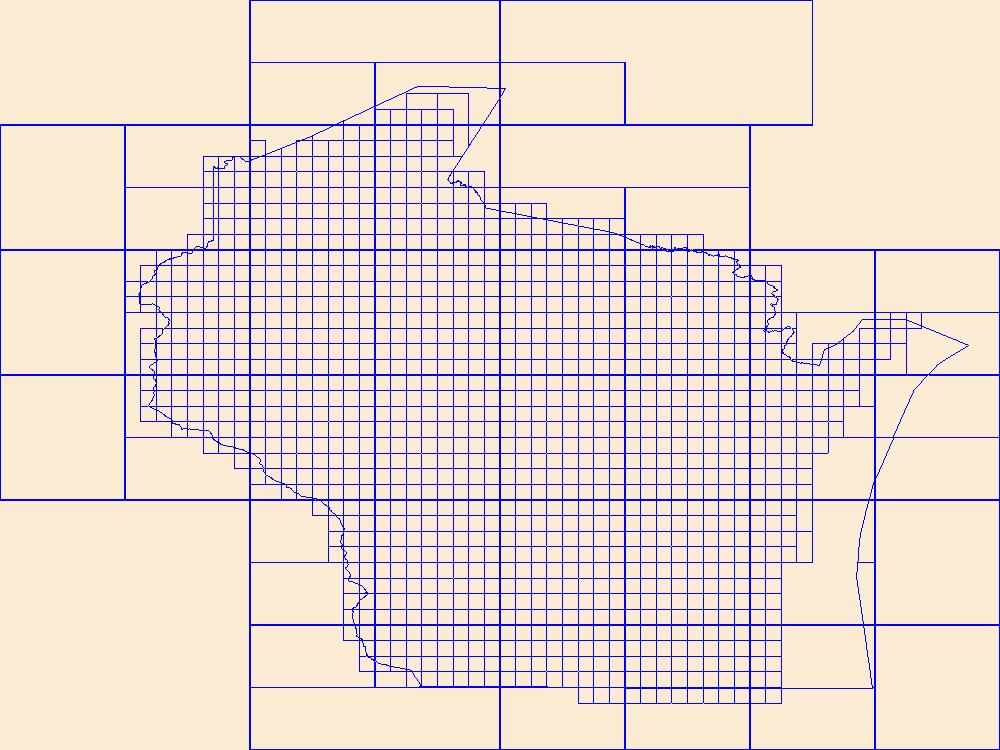
This data represents the map extent for current and historical USGS topographic maps for the United States and Territories, including 1 X 2 Degree, 1 X 1 Degree, 30 X 60 Minute, 15 X 15 Minute, 7.5 X 7.5 Minute, and 3.75 X 3.75 Minute. The grid was generated using ESRI ArcInfo GIS software.
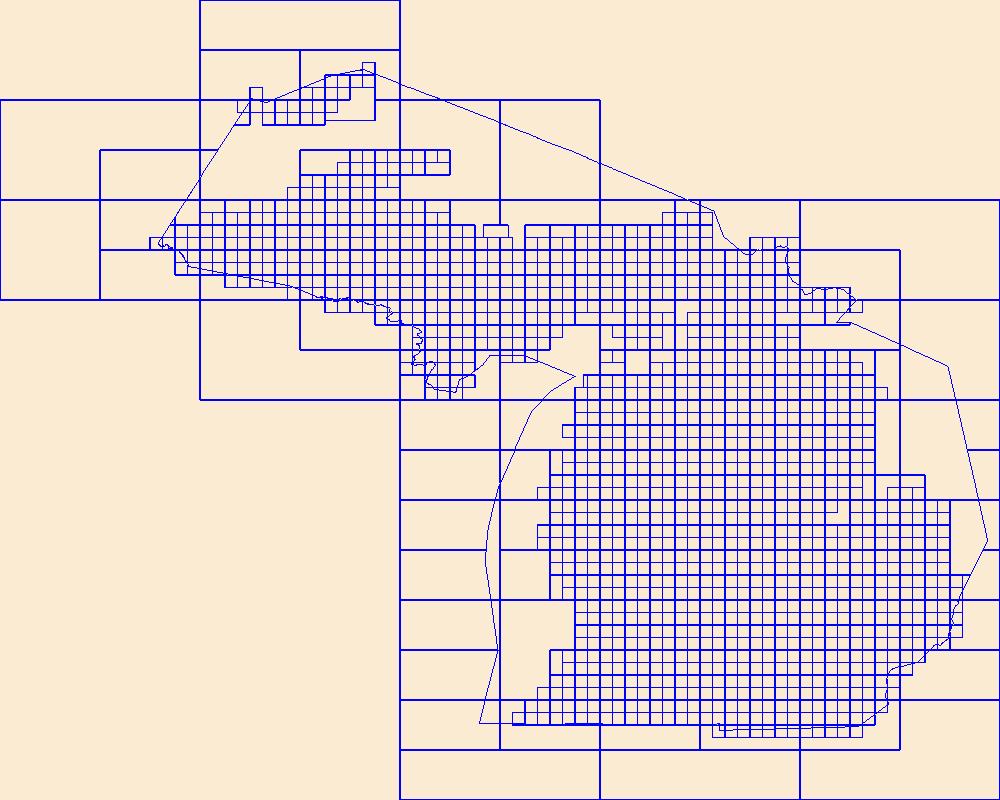
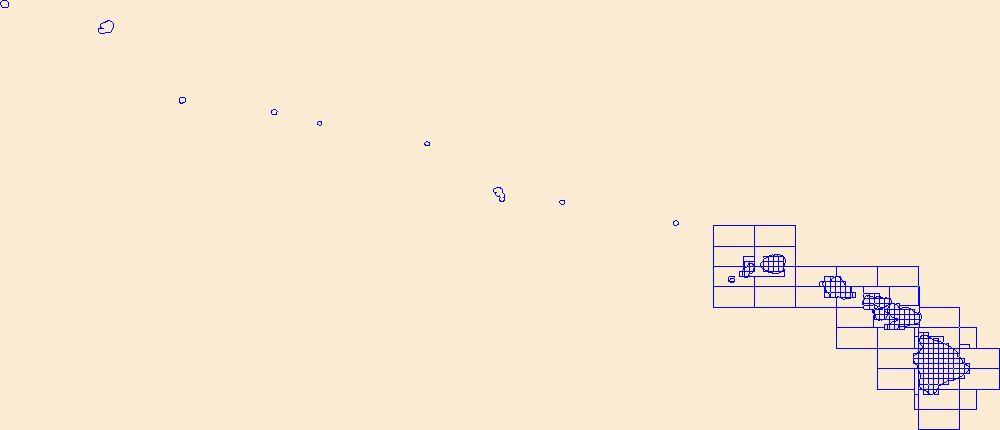
This data represents the map extent for current and historical USGS topographic maps for the United States and Territories, including 1 X 2 Degree, 1 X 1 Degree, 30 X 60 Minute, 15 X 15 Minute, 7.5 X 7.5 Minute, and 3.75 X 3.75 Minute. The grid was generated using ESRI ArcInfo GIS software.
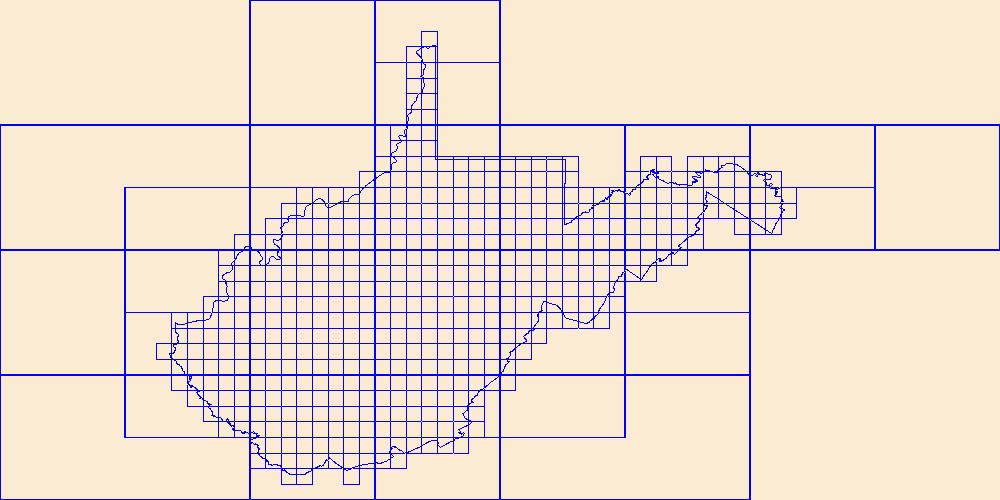
This data represents the map extent for current and historical USGS topographic maps for the United States and Territories, including 1 X 2 Degree, 1 X 1 Degree, 30 X 60 Minute, 15 X 15 Minute, 7.5 X 7.5 Minute, and 3.75 X 3.75 Minute. The grid was generated using ESRI ArcInfo GIS software.
This data represents the map extent for current and historical USGS topographic maps for the United States and Territories, including 1 X 2 Degree, 1 X 1 Degree, 30 X 60 Minute, 15 X 15 Minute, 7.5 X 7.5 Minute, and 3.75 X 3.75 Minute. The grid was generated using ESRI ArcInfo GIS software.
This data represents the map extent for current and historical USGS topographic maps for the United States and Territories, including 1 X 2 Degree, 1 X 1 Degree, 30 X 60 Minute, 15 X 15 Minute, 7.5 X 7.5 Minute, and 3.75 X 3.75 Minute. The grid was generated using ESRI ArcInfo GIS software.

This data represents the map extent for current and historical USGS topographic maps for the United States and Territories, including 1 X 2 Degree, 1 X 1 Degree, 30 X 60 Minute, 15 X 15 Minute, 7.5 X 7.5 Minute, and 3.75 X 3.75 Minute. The grid was generated using ESRI ArcInfo GIS software.
This data represents the map extent for current and historical USGS topographic maps for the United States and Territories, including 1 X 2 Degree, 1 X 1 Degree, 30 X 60 Minute, 15 X 15 Minute, 7.5 X 7.5 Minute, and 3.75 X 3.75 Minute. The grid was generated using ESRI ArcInfo GIS software.
This part of the data release presents projected flooding extent polygon (flood masks) shapefiles based on wave-driven total water levels for Commonwealth of Puerto Rico. There are eight associated flood mask and flood depth shapefiles: one for each of four nearshore wave energy return periods (rp; 10-, 50-, 100-, and 500-years), the pre-storm scenario (base) and the post-storm scenarios.
This dataset consists of short-term (~32 years) shoreline change rates for the north coast of Alaska between the U.S. Canadian Border and the Hulahula River. Rate calculations were computed within a GIS using the Digital Shoreline Analysis System (DSAS) version 4.3, an ArcGIS extension developed by the U.S. Geological Survey. Short-term rates of shoreline change were calculated using a linear regression rate-of-change method based on available shoreline data between 1978 and 2010. A reference baseline was used as the originating point for the orthogonal transects cast by the DSAS software. The transects intersect each shoreline establishing measurement points, which are then used to calculate short-term rates.
Categories: Data;
Types: Citation,
Downloadable,
Map Service,
OGC WFS Layer,
OGC WMS Layer,
Shapefile;
Tags: ANWR,
Arctic,
Arctic National Wildlife Refuge,
Barter Island,
Beaufort Sea,
This dataset consists of short-term (~31 years) shoreline change rates for the north coast of Alaska between the Point Barrow and Icy Cape. Rate calculations were computed within a GIS using the Digital Shoreline Analysis System (DSAS) version 4.3, an ArcGIS extension developed by the U.S. Geological Survey. Short-term rates of shoreline change were calculated using a linear regression rate-of-change method based on available shoreline data between 1979 and 2010. A reference baseline was used as the originating point for the orthogonal transects cast by the DSAS software. The transects intersect each shoreline establishing measurement points, which are then used to calculate short-term rates.
Categories: Data;
Types: Citation,
Downloadable,
Map Service,
OGC WFS Layer,
OGC WMS Layer,
Shapefile;
Tags: Arctic,
Barrow,
CMGP,
Chukchi Sea,
Coastal and Marine Geology Program,
Vegetation types from Kuchler (1975) potential vegetation map were aggregated into 35 classes as part of the VEMAP project (Vegetation/Ecosystem Modeling and Analysis Project, Kittel et al. 1995). Functional vegetation types were reclassified (grouped in ArcMap) by the Conservation Biology Institute to reflect the classification scheme used by Brendan Rogers.
Our objective was to develop a species-distribution model using habitat associations that represent probability of suitable habitat for the species historical range and the range under climate change scenarios including a hot/dry prediction (MIROC3.2) and a cool/wet prediction (ECHAM5) and 1-m and 2-m sea level rise scenarios; urban growth was also inlcuded. Future model predictions were based on extrapolated data for two time steps in the 21st century: mid (2046-2064) and late (2081-2100). Species distributions were modeled with Maxent (Maximum Entropy presence-only algorithm); climate change scenarios were based on precipitation and temperature changes as applied to stream conditions (e.g., flow) modeled with...
Categories: Data;
Types: ArcGIS REST Map Service,
ArcGIS Service Definition,
Downloadable,
Map Service;
Tags: Florida,
GIS,
National Hydrography Dataset,
United States of America,
Watershed,
This feature class was created to assemble oil and gas well information for a comprehensive inventory of energy data pertinent to the Wyoming Landscape Conservation Initiative decision-making process. These data are available as online resources for scientists, resource managers engaged in the Initiative, and other researchers. The GIS data and map services created for this study are available for interactive analysis and/or download at the Energy Geoscience Center WLCI website.
Categories: Data,
pre-SM502.8;
Types: Downloadable,
Map Service,
OGC WFS Layer,
OGC WMS Layer,
Shapefile;
Tags: 503702 = Mowry Composite Total Petroleum System,
50370261 = Mowry Continuous Gas,
503704 = Hilliard-Baxter-Mancos Total Petroleum System,
50370461 = Hilliard-Baxter-Mancos Continuous Gas,
503705 = Mesaverde Total Petroleum System,
This part of the Data Release contains the raster representation of the water-level altitude and water-level change maps developed every 5 years from 1980-2015 for the upper Rio Grande Focus Area Study. The input point data used to generate the water-level altitude maps can be found in the "Groundwater level measurement data used to develop water-level altitude maps in the upper Rio Grande Alluvial Basins" child item of this data release. These digital data accompany Houston, N.A., Thomas, J.V., Foster, L.K., Pedraza, D.E., and Welborn, T.L., 2020, Hydrogeologic framework, groundwater-level altitudes, groundwater-level changes, and groundwater-storage changes in selected alluvial basins of the upper Rio Grande...
Types: Map Service,
OGC WFS Layer,
OGC WMS Layer,
OGC WMS Service;
Tags: Abiquiu Reservoir,
Ahumada,
Alamosa,
Alamosa County,
Alamosa Creek,
Following an explosion at the Deepwater Horizon drilling rig on April 20, 2010, MC252 an estimated 3.19 million barrels of oil leaked into the Northern Gulf of Mexico over 87 days. The endangered Kemp's ridley sea turtle (Lepidochelys kempii [Lk]) has a long established record of using the area near the well as primary foraging grounds. Resulting short- and long-term negative impacts of the oil spill on sea turtles could induce changes in the health and fitness of the Lk population. MC252 oil is known to have entered the foraging areas. Consequently, stable carbon and nitrogen isotope signatures from MC252 oil should be reflected in the food web and in the tissues of organisms such as sea turtles. We measured carbon...
Water velocities and water-quality constituents were measured along planned survey lines, which were generally perpendicular to the shoreline and spaced 100 meters apart, over an approximately 2.3-mile section of nearshore Lake Erie on June 10-12, 2019 (survey 1), and August 19-21, 2019 (survey 2), using a 1200 kHz acoustic Doppler current profiler (ADCP), a YSI 6920 V2 multiparameter sonde, and a YSI EcoMapper autonomous underwater vehicle (AUV). Water-quality data collected in this area included near-surface and three-dimensional measurements of water temperature, specific conductance, pH, dissolved oxygen, turbidity, chlorophyll, and phycocyanin (blue-green algae). The data were geo-referenced with an integrated...
Categories: Data;
Tags: Cleveland,
Easterly Wastewater Treatment Plant (WWTP),
EcoMapper,
Euclid Creek,
Lake Erie,
Orthorectified image from aerial photograph of wetland T9 in the Cottonwood Lake Study Area, Stutsman County, North Dakota. This image is part of a collection of photographs of the study area acquired during July and early August from 1975 to 2015.
|

|
