Filters: Tags: environment (X)
13,602 results (36ms)|
Filters
Date Range
Extensions Types
Contacts
Categories Tag Types
|
(Hyperlink to Official Landing Page for Geospatial Fabric products) The Geospatial Fabric provides a consistent, documented, and topologically connected set of spatial features that create an abstracted stream/basin network of features useful for hydrologic modeling.The GIS vector features contained in this Geospatial Fabric (GF) data set cover the lower 48 U.S. states, Hawaii, and Puerto Rico. Four GIS feature classes are provided for each Region: 1) the Region outline ("one"), 2) Points of Interest ("POIs"), 3) a routing network ("nsegment"), and 4) Hydrologic Response Units ("nhru"). A graphic showing the boundaries for all Regions is provided at http://dx.doi.org/doi:10.5066/F7542KMD. These Regions are identical...
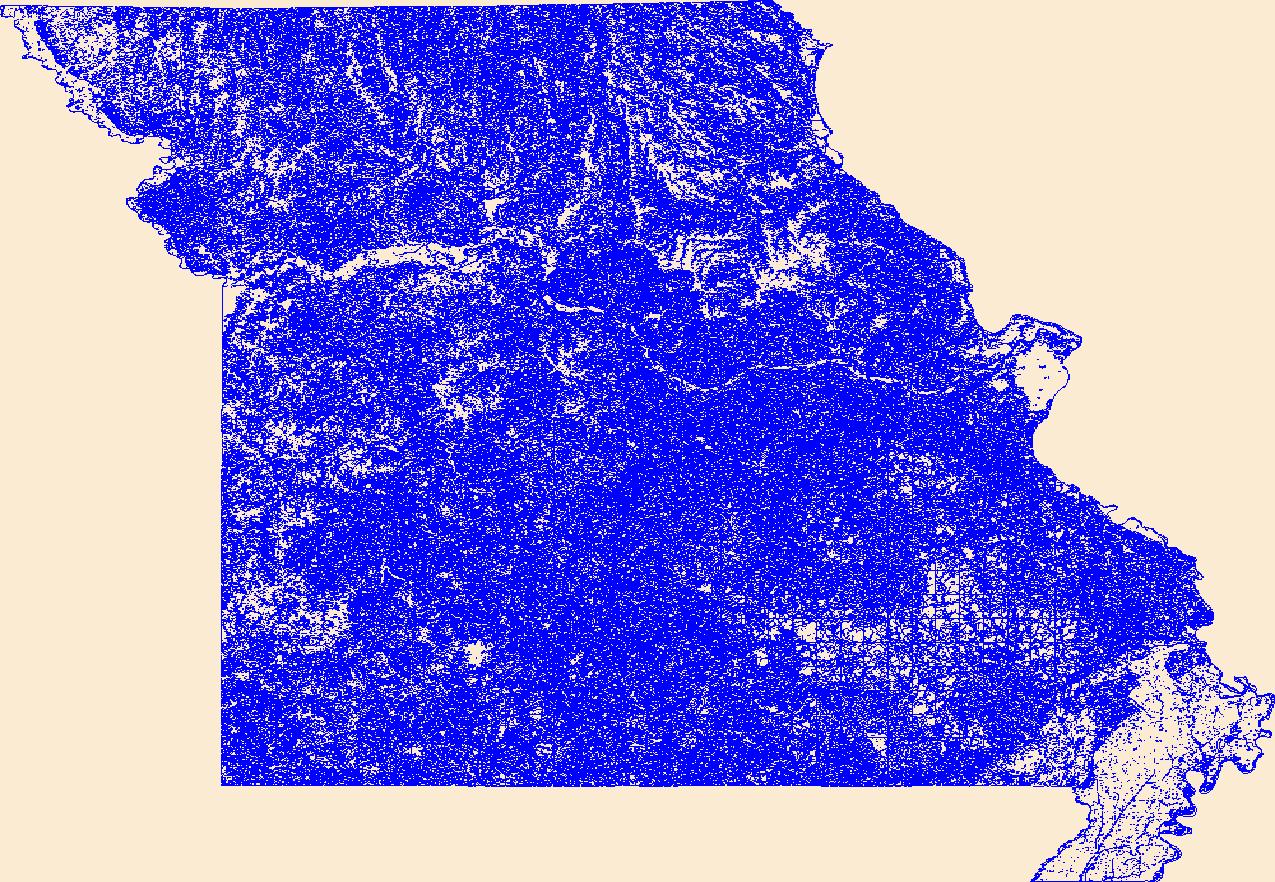
Geospatial data that is a derivative land cover product depicting woodland on topographic maps.

This part of DS 781 presents data for bathymetry for several seafloor maps of the Offshore of Point Conception Map Area, California. The vector data file is included in "BathymetryHS_OffshorePointConception.zip," which is accessible from https://doi.org/10.5066/F7QN64XQ. Shaded-relief bathymetry of the Offshore of Point Conception map area in southern California was generated largely from acoustic-bathymetry data collected by Fugro Pelagos Inc. Acoustic mapping was completed in 2008 using a combination of 400-kHz Reson 7125, 240-kHz Reson 8101, and 100-kHz Reson 8111 multibeam echosounders. Bathymetric-lidar data was collected in the nearshore area by the U.S. Army Corps of Engineers (USACE) Joint Lidar Bathymetry...
A compilation of all known nest records and locations to identify landscape-scale parameters (distance to coast, elevation, slope, and land cover) that provide potential nesting habitat in four regions: northern Alaska, Aleutian Islands, Alaska Peninsula Mountains and Kodiak Island, and Pacific Coastal Mountains (including nearshore interior Canada). These data support the following publication: Felis J.J., Kissling M.L., Kaler R.S.A., Kenney L.A., Lawonn M.J., 2016. Identifying Kittlitz’s Murrelet nesting habitat in North America at the landscape scale. Journal of Fish and Wildlife Management 7(2):xx-xx; e1944-687X. doi: 10.3996/112015-JFWM-116
Categories: Data;
Types: Citation,
Map Service,
OGC WFS Layer,
OGC WMS Layer,
OGC WMS Service;
Tags: biota,
environment,
health,
oceans
This release contains Active Layer Thickness (ALT) and Organic Layer Thickness (OLT) measurements measured along transects in Alaska, 2015. Site condition information in terms of wildfire burns is also included.
Categories: Data;
Types: Citation;
Tags: Active layer,
Active layer thickness,
Alaska,
Borehole nuclear magnetic resonance,
Chatanika,
This dataset represents an archived record of annual California sea otter surveys from 1985-2014. Survey procedures involve counting animals during the "spring survey" -- generally beginning in late April or early May and usually ending in late May early June but may extend into early July, depending on weather conditions. Annual surveys are organized by survey year and within each year, three shapefiles are included: census summary of southern sea otter, extra limit counts of southern sea otter, and range extent of southern sea otter. The surveys, conducted cooperatively by scientists of the U.S. Geological Survey, California Department of Fish and Wildlife, U.S. Fish and Wildlife Service and Monterey Bay Aquarium...
Categories: Data;
Tags: California,
Central California Coastal,
Coast,
Southern California Coastal,
USGS Science Data Catalog (SDC),
Density of all roads within a 5-km radius developed using a circular focal moving window analysis.
Categories: Data;
Types: Downloadable,
GeoTIFF,
Map Service,
Raster;
Tags: Colorado,
Idaho,
Montana,
United States,
Utah,
The Polygons represent the USGS NHD 12 digit HUC polygons which contain known winter roost trees for Northern long-eared bat (Myotis septentrionalis).
Categories: Data;
Types: Downloadable,
Map Service,
OGC WFS Layer,
OGC WMS Layer,
Shapefile;
Tags: Administrative Units,
Biogeographical regions,
Biota,
Natural risk zones,
Protected sites,
Proportion of all sagebrush species land cover within a 1-km radius developed using a circular focal moving window analysis.
Categories: Data;
Types: Downloadable,
GeoTIFF,
Map Service,
Raster;
Tags: Artemisia spp.,
Colorado,
Idaho,
Montana,
United States,
This is a model showing general habitat diversity, including both the structural and cover type diversity. See Open File Report, Rasmussen and Shafroth, Colorado River Conservation Planning for geoprocessing details.
Categories: Data;
Types: Citation,
Downloadable,
Map Service,
OGC WFS Layer,
OGC WMS Layer,
Shapefile;
Tags: Arches National Park,
Canyonlands National Park,
Colorado River,
Grand County,
Moab,
Proportion of salt desert shrub land cover within a 1-km radius developed using a circular focal moving window analysis.
This data set includes WRTDS nutrient flux trend results and the values of daily streamflow trend results displayed in the Quantile-Kendall plots. For 1995-2015 nutrient trends, the method of generalized flow normalization (FNG) was used which explicitly addresses non-stationary streamflow conditions. For 2005-2015 nutrient trends, the WRTDS trend analyses used the method of stationary flow normalization (FNS) because streamflow nonstationarity is difficult to assess over this shorter duration time frame. The 1995-2015 annual nutrient trends were determined for all five nutrient parameters (TP, SRP, TN, NO23, TKN), and monthly trends were evaluated only for SRP. The 2005-2015 annual nutrient trends were determined...
The diversion of freshwater from the Mississippi River is intended to mitigate saltwater intrusion from the Gulf of Mexico and to lessen the concomitant loss of wetland areas. Though effective, freshwater diversion can affect wildlife and habitat; therefore, prediversion and postdiversion data collections are necessary to identify effects. The Davis Pond freshwater diversion area is located between the Mississippi River and Bayou Lafourche and extends to Barataria Bay Basin, Louisiana. Results and interpretations from the prediversion biomonitoring done in 2001- which included data on fish, eagles, and bivalves - are presented in the U.S. Geological Survey (USGS) Scientific Investigations Report 2008-5067, "Davis...
The diversion of freshwater from the Mississippi River is intended to mitigate saltwater intrusion from the Gulf of Mexico and to lessen the concomitant loss of wetland areas. Though effective, freshwater diversion can affect wildlife and habitat; therefore, prediversion and postdiversion data collections are necessary to identify effects. The Davis Pond freshwater diversion area is located between the Mississippi River and Bayou Lafourche and extends to Barataria Bay Basin, Louisiana. Results and interpretations from the prediversion biomonitoring done in 2001- which included data on fish, eagles, and bivalves - are presented in the U.S. Geological Survey (USGS) Scientific Investigations Report 2008-5067, "Davis...
The diversion of freshwater from the Mississippi River is intended to mitigate saltwater intrusion from the Gulf of Mexico and to lessen the concomitant loss of wetland areas. Though effective, freshwater diversion can affect wildlife and habitat; therefore, prediversion and postdiversion data collections are necessary to identify effects. The Davis Pond freshwater diversion area is located between the Mississippi River and Bayou Lafourche and extends to Barataria Bay Basin, Louisiana. Results and interpretations from the prediversion biomonitoring done in 2001- which included data on fish, eagles, and bivalves - are presented in the U.S. Geological Survey (USGS) Scientific Investigations Report 2008-5067, "Davis...
The diversion of freshwater from the Mississippi River is intended to mitigate saltwater intrusion from the Gulf of Mexico and to lessen the concomitant loss of wetland areas. Though effective, freshwater diversion can affect wildlife and habitat; therefore, prediversion and postdiversion data collections are necessary to identify effects. The Davis Pond freshwater diversion area is located between the Mississippi River and Bayou Lafourche and extends to Barataria Bay Basin, Louisiana. Results and interpretations from the prediversion biomonitoring done in 2001- which included data on fish, eagles, and bivalves - are presented in the U.S. Geological Survey (USGS) Scientific Investigations Report 2008-5067, "Davis...
The diversion of freshwater from the Mississippi River is intended to mitigate saltwater intrusion from the Gulf of Mexico and to lessen the concomitant loss of wetland areas. Though effective, freshwater diversion can affect wildlife and habitat; therefore, prediversion and postdiversion data collections are necessary to identify effects. The Davis Pond freshwater diversion area is located between the Mississippi River and Bayou Lafourche and extends to Barataria Bay Basin, Louisiana. Results and interpretations from the prediversion biomonitoring done in 2001 - which included data on fish, eagles, and bivalves - are presented in the U.S. Geological Survey (USGS) Scientific Investigations Report 2008-5067, "Davis...
Biomassfu els currently (1994) supplya round1 4% of the world’se nergy,b ut most of this is in the form of traditional fuelwood, residuesa ndd ung, which is often inefficienta nd can be environmentallyd etrimental.B iomassc an supplyh eat and electricity, liquid and gaseousfu els. A numbero f developedc ountriesd erive a significanta mounto f their primary energy from biomassU: SA 4%, Finland 18%, Sweden1 6%a ndA ustria 13%.P resentlyb iomasse nergy suppliesa t least2 EJ year-’ in WesternE uropew hich is about4 % of primarye nergy (54 ET). Estimates howa likely potentiali n Europei n 2050o f 9.0-13.5 El dependingo n land areas(1 0%o f useablela nd, 33 Mha), yields (lo-15 oven-dry tonnes( ODt) ha-‘), and recoverabler...
Categories: Publication;
Types: Citation;
Tags: Biomass energy,
Carbon sequestration,
Environment,
Fossil fuel substitution,
Land use,
The generation of electricity modifies the physical environment of the globe more than any other industrial activity. Indeed, the industry may already create more long-term economic costs than benefits in terms of associated environmental repercussions. This negative economic equation could become even worse unless long-term and programmed investments into energy supply and conservation strategies are made with proper care for all indentifiable environmental effects. The present publiclyowned electricity industry in the UK has an environmental track record that is patchy but generally unsatisfactory, despite some improvements in recent years. The key issue facing the privatized industry is how comprehensive and...
Categories: Publication;
Types: Citation;
Tags: Accountability,
Electricity,
Environment,
Generation,
Privatization
In an earlier article the author has argued that the turbulent history of nuclear power in Britain and the USA stems from the technology itself, and has little to do with the very different institutional arrangements made for the new technology in the two countries. Nuclear plant has various features which make its planning extraordinarily difficult. Its long lead time, large unit size, capital intensity and dependence on complex infrastructure combine to ensure that mistakes are likely to be made in planning the technology and that what mistakes do occur are expensive. This article aims to expand on the earlier one in two ways; by looking at the apparent success of the French nuclear programme which seems to run...
|

|
